Hyundai 2008 Annual Report Download - page 36
Download and view the complete annual report
Please find page 36 of the 2008 Hyundai annual report below. You can navigate through the pages in the report by either clicking on the pages listed below, or by using the keyword search tool below to find specific information within the annual report.-
 1
1 -
2
-
3
-
4
-
5
-
6
-
7
-
8
-
9
-
10
-
11
-
12
-
13
-
14
-
15
-
16
-
17
-
18
-
19
-
20
-
21
-
22
-
23
-
24
-
25
-
 26
26 -
 27
27 -
 28
28 -
 29
29 -
 30
30 -
 31
31 -
 32
32 -
 33
33 -
 34
34 -
 35
35 -
 36
36 -
 37
37 -
 38
38 -
 39
39 -
 40
40 -
 41
41 -
 42
42 -
 43
43 -
 44
44 -
 45
45 -
 46
46 -
47
-
48
-
49
-
50
-
51
-
52
-
53
-
54
-
55
-
56
-
57
-
58
-
59
-
60
-
61
-
62
-
63
-
64
-
65
-
66
-
67
-
68
-
69
-
70
-
71
 |
 |

HYUNDAI MOTOR COMPANY AND SUBSIDIARIES
>>
HYUNDAI MOTOR COMPANY AND SUBSIDIARIES
>>
HYUNDAI MOTOR COMPANY I 2008 AnnuAl RepoRt I HYUNDAI MOTOR COMPANY I 2008 AnnuAl RepoRt I
2008 2007 2008 2007
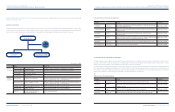
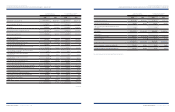
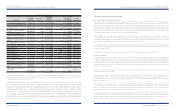
Cash flows from operating activities:
Net income
₩
1,092,552
₩
1,956,087 $868,828 $1,555,536
Adjustments to reconcile net income to net cash
provided by (used in) operating activities:
Depreciation 2,587,849 2,088,960 2,057,932 1,661,201
Amortization of intangibles 849,811 692,205 675,794 550,461
Bad debt expenses 269,684 127,020 214,460 101,010
Loss on foreign exchange translation, net 2,287,087 147,037 1,818,757 116,928
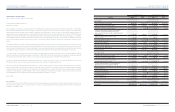
Gain on valuation of investment securities
accounted for using the equity method, net (356,972) (281,603) (283,874) (223,939)
Gain on disposal of investment securities
accounted for using the equity method (2,025) (4,484) (1,611) (3,566)
Loss (gain) on valuation of derivatives, net (1,790,314) 25,295 (1,423,709) 20,115
Loss on disposal of trade notes and accounts receivable 253,905 245,164 201,913 194,961
Loss on disposal of property, plant and
equipment, net 61,389 11,706 48,818 9,309
Gain on disposal of short-term investment
securities, net (1,215) (30,621) (966) (24,351)
Gain on disposal of long-term investment securities, net (38,452) (35,959) (30,578) (28,596)
Dividends of investment securities accounted for
using the equity method 63,242 78,067 50,292 62,081
Provision for severance benefits 966,356 674,011 768,474 535,993
Amortization of discount on debentures 820 2,841 652 2,259
Impairment loss on intangibles 2,747 1,114 2,184 886
Provision for accrued warranties 942,335 647,470 749,372 514,887
Loss on impairment of investment securities 5,481 1,964 4,359 1,562
Impairment loss on property, plant and equipment 33,966 79 27,011 63
Other 54,200 201,868 43,102 160,532
2008 2007 2008 2007
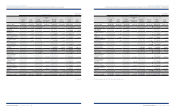
Cash flows from operating activities:
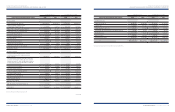
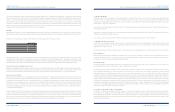
Changes in operating assets and liabilities:
Increase in trade notes and accounts receivable
₩
(1,127,805)
₩
(1,645,796) $(896,863) $(1,308,784)
Decrease (increase) in trade notes and
accounts receivable-other (871,880) 218,426 (693,344) 173,699
Increase in inventories (5,633,952) (1,562,826) (4,480,280) (1,242,804)
Increase in advances and other current assets (563,646) (514,360) (448,227) (409,034)
Decrease (increase) in deferred tax assets (444,373) 64,716 (353,378) 51,464
Increase (decrease) in trade notes and accounts payable 1,174,661 (1,857,415) 934,124 (1,477,070)
Increase in accounts payable-other 481,718 1,376,475 383,076 1,094,612
Increase (decrease) in income tax payable (54,897) 416,104 (43,656) 330,898
Increase in accrued expenses 273,380 76,557 217,400 60,880
Increase (decrease) in deferred tax liabilities (406,605) 322,842 (323,344) 256,733
Increase in withholding and other current liabilities 532,571 345,176 423,516 274,494
Decrease in accrued warranties (628,380) (632,476) (499,706) (502,963)
Payment of severance benefits (787,393) (805,708) (626,157) (640,722)
Increase in individual severance insurance deposits (68,407) (403) (54,399) (320)
Other 15,254 133,739 12,129 106,354
(827,308) 2,483,272 (657,899) 1,974,769
Cash flows from investing activities:
Cash inflows from investing activities:
Proceeds from withdrawal of short-term
financial instruments 3,725,846 5,162,383 2,962,899 4,105,275
Proceeds from disposal of short-term
investment securities 120,774 438,027 96,043 348,332
Proceeds from disposal of long-term
investment securities 325,851 135,580 259,126 107,817
Proceeds from disposal of investment securities
accounted for using the equity method 7,707 70,080 6,129 55,730
Proceeds from disposal of property,
plant and equipment 214,493 406,783 170,571 323,485
Reduction in other current assets 47,377 30,182 37,676 24,001
Increase in other financial business liabilities 632,139 37,217 502,695 29,596
Reduction in other assets 65,565 368,154 52,139 292,767
5,139,752 6,648,406 4,087,278 5,287,003
(Continued)
(Continued)
Korean Won in millionsKorean Won in millions U. S. Dollars (Note 2) in thousands U. S. Dollars (Note 2) in thousands