Honda 2010 Annual Report Download - page 7
Download and view the complete annual report
Please find page 7 of the 2010 Honda annual report below. You can navigate through the pages in the report by either clicking on the pages listed below, or by using the keyword search tool below to find specific information within the annual report.-
 1
1 -
 2
2 -
 3
3 -
 4
4 -
 5
5 -
 6
6 -
 7
7 -
 8
8 -
 9
9 -
 10
10 -
 11
11 -
 12
12 -
 13
13 -
 14
14 -
 15
15 -
 16
16 -
 17
17 -
 18
18 -
19
-
20
-
21
-
22
-
23
-
24
-
25
-
26
-
27
-
28
-
29
-
30
-
31
-
32
-
33
-
34
-
35
-
36
-
37
-
38
-
39
-
40
-
41
-
42
-
43
-
44
-
45
-
46
-
47
-
48
-
49
-
50
-
51
-
52
-
53
-
54
-
55
-
56
-
57
-
58
-
59
-
60
-
61
-
62
-
63
-
64
-
65
-
66
-
67
-
68
-
69
-
70
-
71
-
72
-
73
-
74
-
75
-
76
 |
 |

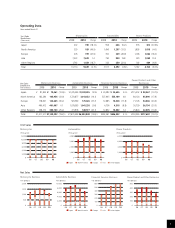
Unit Sales
Breakdown
(Thousands)
Motorcycles Automobiles Power Products
2009 2010 Change 2009 2010 Change 2009 2010 Change
Japan 232 190 (18.1)%556 646 16.2%516 322 (37.6)%
North America 320 189 (40.9) 1,496 1,297 (13.3) 1,893 1,818 (4.0)
Europe 276 199 (27.9) 350 249 (28.9) 1,306 1,066 (18.4)
Asia 7,523 7,628 1.4 793 950 19.8 970 1,069 10.2
Other Regions 1,763 1,433 (18.7) 322 250 (22.4) 502 469 (6.6)
Total 10,114 9,639 (4.7)%3,517 3,392 (3.6)%5,187 4,744 (8.5)%
Net Sales
Breakdown
Yen (millions)
Motorcycle Business Automobile Business Financial Services Business
Power Product and Other
Businesses
2009 2010 Change 2009 2010 Change 2009 2010 Change 2009 2010 Change
Japan ¥ 81,822 ¥ 70,461 (13.9)%
¥1,225,384 ¥1,383,855
12.9%¥ 24,083 ¥ 24,635 2.3%¥115,252 ¥ 98,367 (14.7)%
North America 182,284 103,956 (43.0)
3,723,877 3,013,432
(19.1) 527,905 553,169 4.8 80,124 65,890 (17.8)
Europe 178,621 124,665 (30.2)
923,580 575,326
(37.7) 12,685 10,428 (17.8) 71,126 54,366 (23.6)
Asia 460,412 461,067 0.1
1,079,585 1,041,258
(3.6) 4,736 4,318 (8.8) 50,739 36,754 (27.6)
Other Regions 508,372 380,143 (25.2)
721,978 540,977
(25.1) 12,852 13,802 7.4 25,824 22,305 (13.6)
Total ¥1,411,511 ¥1,140,292 (19.2)%¥7,674,404 ¥6,554,848 (14.6)%¥582,261 ¥606,352 4.1%¥343,065 ¥277,682 (19.1)%
Operating Data
Years ended March 31
Motorcycle Business Automobile Business Financial Services Business
Power
Product
and
Other
Businesses
Motorcycles Automobiles Power Products
( )
06 07 08 09 10
12,000
10,000
8,000
6,000
4,000
2,000
0
(Thousands)
( )
06 07 08 09 10
4,000
3,000
2,000
1,000
0
(Thousands)
( )
06 07 08 09 10
8,000
6,000
4,000
2,000
0
(Thousands)
Other Regions
( )
Japan North America Europe Asia Other Regions
( )
06 07 08 09 10
2,000
1,500
1,000
500
0
Yen (billions)
( )
06 07 08 09 10
10,000
8,000
6,000
4,000
2,000
0
Yen (billions)
( )
Japan North America Europe Asia Other Regions
( )
06 07 08 09 10
600
500
400
300
200
100
0
Yen (billions)
( )
06 07 08 09 10
500
400
300
200
100
0
Yen (billions)
Other Regions
Unit Sales
Net Sales
5