Honda 2010 Annual Report Download - page 6
Download and view the complete annual report
Please find page 6 of the 2010 Honda annual report below. You can navigate through the pages in the report by either clicking on the pages listed below, or by using the keyword search tool below to find specific information within the annual report.-
 1
1 -
 2
2 -
 3
3 -
 4
4 -
 5
5 -
 6
6 -
 7
7 -
 8
8 -
 9
9 -
 10
10 -
 11
11 -
 12
12 -
 13
13 -
 14
14 -
 15
15 -
 16
16 -
 17
17 -
18
-
19
-
20
-
21
-
22
-
23
-
24
-
25
-
26
-
27
-
28
-
29
-
30
-
31
-
32
-
33
-
34
-
35
-
36
-
37
-
38
-
39
-
40
-
41
-
42
-
43
-
44
-
45
-
46
-
47
-
48
-
49
-
50
-
51
-
52
-
53
-
54
-
55
-
56
-
57
-
58
-
59
-
60
-
61
-
62
-
63
-
64
-
65
-
66
-
67
-
68
-
69
-
70
-
71
-
72
-
73
-
74
-
75
-
76
 |
 |

Yen
(millions except per share data)
U.S. dollars
(millions except per share data)
2008 2009 2010 2010
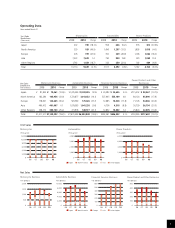
Net sales and other operating revenue ¥12,002,834 ¥10,011,241 ¥ 8,579,174 $ 92,210
Operating income 953,109 189,643 363,775 3,910
Income before income taxes and
equity in income of affiliates 895,841 161,734 336,198 3,613
Equity in income of affiliates 118,942 99,034 93,282 1,003
Net income attributable to Honda Motor Co., Ltd. 600,039 137,005 268,400 2,885
Cash dividends paid during the period 152,590 139,724 61,696 663
Research and development 587,959 563,197 463,354 4,980
Total assets 12,615,543 11,818,917 11,629,115 124,990
Total Honda Motor Co., Ltd. shareholders’ equity 4,550,479 4,007,288 4,328,640 46,525
Capital expenditures
(excluding purchase of operating lease assets) 654,030 633,913 348,981 3,751
Depreciation
(excluding property on operating leases) 417,393 441,868 401,743 4,318
Per share data
Net income attributable to Honda Motor Co., Ltd. ¥ 330.54 ¥ 75.50 ¥ 147.91 $ 1.59
Dividends paid 84 77 34 0.37
Total Honda Motor Co., Ltd. shareholders’ equity 2,507.79 2,208.35 2,385.45 25.64
Financial Data
Honda Motor Co., Ltd. and Subsidiaries
Years ended March 31
Note: United States dollar amounts have been translated from yen solely for the convenience of the reader at the rate of ¥93.04=U.S.$1, the mean of the telegraphic transfer selling
exchange rate and the telegraphic transfer buying exchange rate prevailing on the Tokyo foreign exchange market on March 31, 2010. No representation is made that yen
amounts could have been, or could be, converted into U.S. dollars at that rate or any other rate on this or any other data or at all.
Net Sales and Other Operating Revenue Operating Income and Operating Margin Equity in Income of Affiliates
Capital Expenditures and Depreciation
(Excluding Property on Operating Leases)
Net Income
Attributable to Honda Motor
Co., Ltd.
and Return on Equity (ROE)
Total Assets, Total Honda Motor Co., Ltd.
Shareholders’ Equity and Total Honda
Motor Co., Ltd. Shareholders’ Equity per
Common Share
12,000
10,000
8,000
6,000
4,000
2,000
0
( )
06 07 08 09 10
Yen (billions)
( )
600
450
300
150
0
(%)
20.0
15.0
10.0
5.0
0
06 07 08 09 10
Yen (billions)
Net Income Attributable to
Honda Motor Co., Ltd. (left scale)
ROE (right scale)
( )
1,000
750
500
250
0
10.0
7.5
5.0
2.5
0
(%)
06 07 08 09 10
Yen (billions)
Operating Income (left scale)
Operating Margin (right scale)
(Yen)
12,500
10,000
7,500
5,000
2,500
0
2,500
2,000
1,500
1,000
500
0
06 07 08 09 10
Yen (billions)
Total Assets (left scale)
Total Honda Motor Co., Ltd. Shareholders’
Equity (left scale)
Total Honda Motor Co., Ltd. Shareholders’
Equity per Common Share (right scale)
( )
120
100
80
60
40
20
0
06 07 08 09 10
Yen (billions)
( )
600
400
200
0
06 07 08 09 10
Yen (billions)
Capital Expenditures
Depreciation
Financial Highlights
4