Honda 2010 Annual Report Download - page 66
Download and view the complete annual report
Please find page 66 of the 2010 Honda annual report below. You can navigate through the pages in the report by either clicking on the pages listed below, or by using the keyword search tool below to find specific information within the annual report.-
 1
1 -
2
-
3
-
4
-
5
-
6
-
7
-
8
-
9
-
10
-
11
-
12
-
13
-
14
-
15
-
16
-
17
-
18
-
19
-
20
-
21
-
22
-
23
-
24
-
25
-
26
-
27
-
28
-
29
-
30
-
31
-
32
-
33
-
34
-
35
-
36
-
37
-
38
-
39
-
40
-
41
-
42
-
43
-
44
-
45
-
46
-
47
-
48
-
49
-
50
-
51
-
52
-
53
-
54
-
55
-
 56
56 -
 57
57 -
 58
58 -
 59
59 -
 60
60 -
 61
61 -
 62
62 -
 63
63 -
 64
64 -
 65
65 -
 66
66 -
 67
67 -
 68
68 -
 69
69 -
 70
70 -
 71
71 -
 72
72 -
 73
73 -
 74
74 -
 75
75 -
 76
76
 |
 |

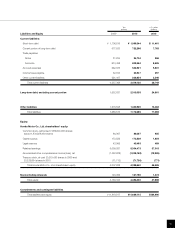
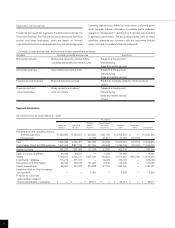
(2) Supplemental geographical information based on the location of the Company and its subsidiaries
As of and for the year ended March 31, 2008
Yen (millions)
North Other Reconciling
Japan America Europe Asia Regions Total Items Consolidated
Net sales and other
operating revenue:
External customers ¥2,053,401 ¥6,091,512 ¥1,502,240 ¥1,307,117 ¥1,048,564 ¥12,002,834 ¥ — ¥12,002,834
Transfers between
geographic areas 2,835,639 173,751 91,983 331,173 44,253 3,476,799 (3,476,799) —
Total 4,889,040 6,265,263 1,594,223 1,638,290 1,092,817 15,479,633 (3,476,799) 12,002,834
Cost of sales, SG&A and
R&D expenses 4,696,482 5,832,635 1,542,676 1,507,566 976,335 14,555,694 (3,505,969) 11,049,725
Operating income 192,558 432,628 51,547 130,724 116,482 923,939 29,170 953,109
Assets 3,127,143 6,863,970 948,544 1,080,439 574,890 12,594,986 20,557 12,615,543
Long-lived assets ¥1,084,163 ¥1,589,356 ¥ 171,030 ¥ 260,141 ¥ 128,156 ¥ 3,232,846 ¥ — ¥ 3,232,846
As of and for the year ended March 31, 2009
Yen (millions)
North Other Reconciling
Japan America Europe Asia Regions Total Items Consolidated
Net sales and other
operating revenue:
External customers ¥1,871,962 ¥4,534,684 ¥1,191,540 ¥1,335,091 ¥1,077,964 ¥10,011,241 ¥ — ¥10,011,241
Transfers between
geographic areas 2,290,625 244,440 87,362 273,140 66,256 2,961,823 (2,961,823) —
Total 4,162,587 4,779,124 1,278,902 1,608,231 1,144,220 12,973,064 (2,961,823) 10,011,241
Cost of sales, SG&A and
R&D expenses 4,324,203 4,699,422 1,268,701 1,504,628 1,009,158 12,806,112 (2,984,514) 9,821,598
Operating income (loss) (161,616) 79,702 10,201 103,603 135,062 166,952 22,691 189,643
Assets 3,078,478 6,547,880 766,594 1,016,059 450,081 11,859,092 (40,175) 11,818,917
Long-lived assets ¥1,140,316 ¥1,918,579 ¥ 110,543 ¥ 253,113 ¥ 119,373 ¥ 3,541,924 ¥ — ¥ 3,541,924
As of and for the year ended March 31, 2010
Yen (millions)
North Other Reconciling
Japan America Europe Asia Regions Total Items Consolidated
Net sales and other
operating revenue:
External customers ¥1,864,513 ¥3,752,417 ¥769,857 ¥1,320,047 ¥872,340 ¥ 8,579,174 ¥ — ¥ 8,579,174
Transfers between
geographic areas 1,441,264 155,799 55,615 198,533 24,151 1,875,362 (1,875,362) —
Total 3,305,777 3,908,216 825,472 1,518,580 896,491 10,454,536 (1,875,362) 8,579,174
Cost of sales, SG&A and
R&D expenses 3,334,912 3,671,837 836,344 1,405,574 850,683 10,099,350 (1,883,951) 8,215,399
Operating income (loss) (29,135) 236,379 (10,872) 113,006 45,808 355,186 8,589 363,775
Assets 2,947,764 6,319,896 591,423 1,050,727 619,345 11,529,155 99,960 11,629,115
Long-lived assets ¥1,113,386 ¥1,861,596 ¥107,262 ¥ 240,704 ¥162,198 ¥ 3,485,146 ¥ — ¥ 3,485,146
64