Honda 2010 Annual Report Download - page 40
Download and view the complete annual report
Please find page 40 of the 2010 Honda annual report below. You can navigate through the pages in the report by either clicking on the pages listed below, or by using the keyword search tool below to find specific information within the annual report.-
 1
1 -
2
-
3
-
4
-
5
-
6
-
7
-
8
-
9
-
10
-
11
-
12
-
13
-
14
-
15
-
16
-
17
-
18
-
19
-
20
-
21
-
22
-
23
-
24
-
25
-
26
-
27
-
28
-
29
-
 30
30 -
 31
31 -
 32
32 -
 33
33 -
 34
34 -
 35
35 -
 36
36 -
 37
37 -
 38
38 -
 39
39 -
 40
40 -
 41
41 -
 42
42 -
 43
43 -
 44
44 -
 45
45 -
 46
46 -
 47
47 -
 48
48 -
 49
49 -
 50
50 -
51
-
52
-
53
-
54
-
55
-
56
-
57
-
58
-
59
-
60
-
61
-
62
-
63
-
64
-
65
-
66
-
67
-
68
-
69
-
70
-
71
-
72
-
73
-
74
-
75
-
76
 |
 |

Operating and Financial Review
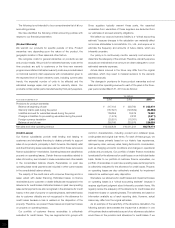
Net Sales and Other Operating Revenue
Honda’s consolidated net sales and other operating revenue
(hereafter, “net sales”) for the fiscal year ended March 31, 2010,
decreased ¥1,432.0 billion, or 14.3%, to ¥8,579.1 billion from the
fiscal year ended March 31, 2009, due mainly to negative foreign
currency translation effects and decreased net sales in automobile
business. Honda estimates that, by applying Japanese yen exchange
rates of the previous fiscal year to the current fiscal year, net sales for
the year would have decreased by approximately ¥746.7 billion, or
7.5%, compared to the decrease as reported of ¥1,432.0 billion,
which includes negative foreign currency translation effects.
Net sales in Japan increased ¥130.7 billion, or 9.0%, to ¥1,577.3
billion from the previous fiscal year and overseas net sales decreased
¥1,562.8 billion, or 18.2%, to ¥7,001.8 billion from the previous
fiscal year.
Operating Costs and Expenses
Operating costs and expenses decreased ¥1,606.1 billion, or
16.4%, to ¥8,215.3 billion from the previous fiscal year. Cost of sales
decreased ¥1,004.8 billion, or 13.5%, to ¥6,414.7 billion from the
previous fiscal year, due mainly to a decrease in costs attributable to
the decreased net sales, positive foreign currency effects and
continuing cost reduction. Selling, general and administrative
expenses decreased ¥501.4 billion, or 27.3%, to ¥1,337.3 billion
from the previous fiscal year, due mainly to positive foreign currency
effects, a decrease in provisions for credit losses and losses on
lease residual values in financial services business and the impact of
expenses in the previous year which related to withdrawal from
some racing activities and cancellations of development of new
models. R&D expenses decreased by ¥99.8 billion, or 17.7%, to
¥463.3 billion from the previous fiscal year, due mainly to improving
development efficiency, while improving safety and environmental
technologies and enhancing of the attractiveness of the products.
Operating Income
Operating income increased ¥174.1 billion, or 91.8%, to ¥363.7
billion from the previous fiscal year, due mainly to decreased selling,
general and administrative expenses and R&D expenses and
continuing cost reduction, which was partially offset by a decrease
in income attributable to the decreased net sales, negative foreign
currency effects and an increase in fixed costs per unit as a result of
reduced production. Excluding negative foreign currency effects of
¥167.5 billion, Honda estimates operating income increased ¥341.7
billion.
With respect to the discussion above of the changes, management
identified the factors and used what it believes to be a reasonable
method to analyze the respective changes in such factors.
Management analyzed changes in these factors at the levels of the
Company and its material consolidated subsidiaries. “Foreign
currency effects” consist of “translation adjustments”, which come
from the translation of the currency of foreign subsidiaries’ financial
statements into Japanese yen, and “foreign currency adjustments”,
which result from foreign-currency-denominated sales. With respect
to “foreign currency adjustments”, management analyzed foreign
currency adjustments primarily related to the following currencies:
U.S. dollar, Canadian dollar, Euro, British pound, Brazilian real and
Japanese yen, at the level of the Company and its material
consolidated subsidiaries.
Income before Income Taxes
and Equity in Income of Affiliates
Income before income taxes and equity in income of affiliates
increased ¥174.4 billion, or 107.9%, to ¥336.1 billion. Main factors
of this increase except factors relating operating income are as
follows:
Unrealized gains and losses related to derivative instruments had
a positive impact of ¥22.2 billion. Other income (expenses) excluding
unrealized gains and losses related to derivative instruments had a
negative impact of ¥21.9 billion, due mainly to a decrease in foreign
currency transaction gains, which was partially offset by a decrease
of impairment losses on investment securities.
Income Tax Expense
Income tax expense increased ¥37.0 billion, or 33.7%, to ¥146.8
billion from the previous fiscal year. The effective tax rate decreased
24.2 percentage points to 43.7% from the previous fiscal year. The
decrease in the effective tax rate was due to (1) a decrease in tax
expenses of ¥21.2 billion related to the dividend and royalty income
from foreign subsidiaries and affiliates, net of foreign tax credit,
because the Company did not utilize indirect foreign tax credit in the
prior fiscal year due to lower taxable income and (2) a decrease in
the valuation allowance of ¥7.0 billion recorded during the fiscal year
ended March 31, 2010.
Equity in Income of Affiliates
Equity in income of affiliates decreased ¥5.7 billion, or 5.8%, to
¥93.2 billion, due mainly to an increase in expenses and tax expense
at affiliates in certain countries in Asia, which was partially offset by
a decrease in expenses at certain affiliates in Japan.
12,000
Yen (billions)
10,000
8,000
6,000
4,000
2,000
2006 2007 2008 2009 2010
0
Net Sales and Other Operating Revenue
Years ended March 31
38
Financial Review