Honda 2010 Annual Report Download - page 61
Download and view the complete annual report
Please find page 61 of the 2010 Honda annual report below. You can navigate through the pages in the report by either clicking on the pages listed below, or by using the keyword search tool below to find specific information within the annual report.-
 1
1 -
2
-
3
-
4
-
5
-
6
-
7
-
8
-
9
-
10
-
11
-
12
-
13
-
14
-
15
-
16
-
17
-
18
-
19
-
20
-
21
-
22
-
23
-
24
-
25
-
26
-
27
-
28
-
29
-
30
-
31
-
32
-
33
-
34
-
35
-
36
-
37
-
38
-
39
-
40
-
41
-
42
-
43
-
44
-
45
-
46
-
47
-
48
-
49
-
50
-
 51
51 -
 52
52 -
 53
53 -
 54
54 -
 55
55 -
 56
56 -
 57
57 -
 58
58 -
 59
59 -
 60
60 -
 61
61 -
 62
62 -
 63
63 -
 64
64 -
 65
65 -
 66
66 -
 67
67 -
 68
68 -
 69
69 -
 70
70 -
 71
71 -
72
-
73
-
74
-
75
-
76
 |
 |

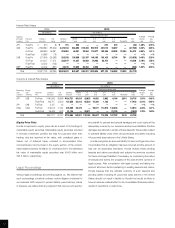
Honda Motor Co., Ltd. and Subsidiaries
Years ended March 31, 2008, 2009 and 2010
Yen U.S. dollars
(millions) (millions)
2008 2009 2010 2010
Cash fl ows from operating activities:
Net income ¥ 627,347 ¥ 150,933 ¥ 282,611 $ 3,038
Adjustments to reconcile net income to net cash provided by operating activities:
Depreciation excluding property on operating leases 417,393 441,868 401,743 4,318
Depreciation of property on operating leases 101,032 195,776 227,931 2,450
Deferred income taxes 31,341 41,773 56,606 608
Equity in income of affi liates (118,942) (99,034) (93,282) (1,003)
Dividends from affi liates 67,764 65,140 140,901 1,514
Provision for credit and lease residual losses on fi nance subsidiaries—receivables 58,011 77,016 40,062 431
Impairment loss on investments in securities 577 26,001 603 6
Impairment loss on long-lived assets and goodwill excluding property
on operating leases — 21,597 548 6
Impairment loss on property on operating leases 5,850 18,528 3,312 36
Loss (gain) on derivative instruments, net 70,251 (15,506) (37,753) (406)
Decrease (increase) in assets:
Trade accounts and notes receivable (67,696) (30,025) (6,910) (74)
Inventories (100,622) (262,782) 352,994 3,794
Other current assets (2,609) (82,838) 103,071 1,108
Other assets (130,666) 8,640 24,150 260
Increase (decrease) in liabilities:
Trade accounts and notes payable 32,327 (133,662) 151,345 1,627
Accrued expenses (24,768) (102,711) (20,457) (220)
Income taxes payable 20 (12,861) (14,524) (156)
Other current liabilities 2,301 10,630 5,662 61
Other liabilities 179,537 74,872 (30,146) (324)
Other, net (21,530) (9,714) (44,255) (477)
Net cash provided by operating activities 1,126,918 383,641 1,544,212 16,597
Cash fl ows from investing activities:
Increase in investments and advances (6,417) (4,879) (19,419) (209)
Decrease in investments and advances 1,270 1,921 14,078 151
Payments for purchases of available-for-sale securities (158,426) (31,936) (5,871) (63)
Proceeds from sales of available-for-sale securities 179,911 26,896 4,945 53
Payments for purchases of held-to-maturity securities (39,482) (17,348) (21,181) (228)
Proceeds from redemptions of held-to-maturity securities 32,557 32,667 6,283 68
Capital expenditures (668,228) (635,190) (392,062) (4,214)
Proceeds from sales of property, plant and equipment 26,868 18,843 24,472 263
Acquisitions of fi nance subsidiaries—receivables (2,712,775) (2,303,930) (1,448,146) (15,565)
Collections of fi nance subsidiaries—receivables 2,312,311 2,023,031 1,595,235 17,147
Sales (repurchases) of fi nance subsidiaries—receivables, net 158,497 324,672 (55,168) (593)
Purchases of operating lease assets (839,261) (668,128) (544,027) (5,847)
Proceeds from sales of operating lease assets 26,776 100,017 245,110 2,634
Net cash used in investing activities (1,686,399) (1,133,364) (595,751) (6,403)
Cash fl ows from fi nancing activities:
Increase (decrease) in short-term debt, net 601,957 270,795 (649,641) (6,982)
Proceeds from long-term debt 1,061,792 1,299,984 1,132,222 12,168
Repayments of long-term debt (782,749) (889,483) (963,833) (10,359)
Dividends paid (152,590) (139,724) (61,696) (663)
Dividends paid to noncontrolling interests (9,663) (10,841) (16,278) (175)
Sales (purchases) of treasury stock, net (30,746) 131 (18) (0)
Net cash provided by (used in) fi nancing activities 688,001 530,862 (559,244) (6,011)
Effect of exchange rate changes on cash and cash equivalents (23,164) (141,672) 40,316 434
Net change in cash and cash equivalents 105,356 (360,533) 429,533 4,617
Cash and cash equivalents at beginning of year 945,546 1,050,902 690,369 7,420
Cash and cash equivalents at end of year ¥1,050,902 ¥ 690,369 ¥1,119,902 $12,037
59
Consolidated Statements of Cash Flows