Honda 2010 Annual Report Download - page 62
Download and view the complete annual report
Please find page 62 of the 2010 Honda annual report below. You can navigate through the pages in the report by either clicking on the pages listed below, or by using the keyword search tool below to find specific information within the annual report.-
 1
1 -
2
-
3
-
4
-
5
-
6
-
7
-
8
-
9
-
10
-
11
-
12
-
13
-
14
-
15
-
16
-
17
-
18
-
19
-
20
-
21
-
22
-
23
-
24
-
25
-
26
-
27
-
28
-
29
-
30
-
31
-
32
-
33
-
34
-
35
-
36
-
37
-
38
-
39
-
40
-
41
-
42
-
43
-
44
-
45
-
46
-
47
-
48
-
49
-
50
-
51
-
 52
52 -
 53
53 -
 54
54 -
 55
55 -
 56
56 -
 57
57 -
 58
58 -
 59
59 -
 60
60 -
 61
61 -
 62
62 -
 63
63 -
 64
64 -
 65
65 -
 66
66 -
 67
67 -
 68
68 -
 69
69 -
 70
70 -
 71
71 -
 72
72 -
73
-
74
-
75
-
76
 |
 |

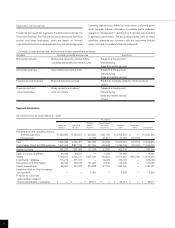
Segment Information
Honda has four reportable segments: the Motorcycle business, the
Automobile business, the Financial services business and the Power
product and other businesses, which are based on Honda’s
organizational structure and characteristics of products and services.
Principal products and services, and functions of each segment are as follows:
Segment Principal products and services Functions
Motorcycle business Motorcycles, all-terrain vehicles (ATVs), Research & Development
personal watercrafts and relevant parts Manufacturing
Sales and related services
Automobile business Automobiles and relevant parts Research & Development
Manufacturing
Sales and related services
Financial services business Financial, insurance services Retail loan and lease related to Honda products
Others
Power product and Power products and relevant Research & Development
other businesses parts, and others Manufacturing
Sales and related services
Others
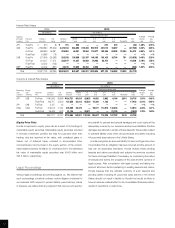
Segment Information
As of and for the year ended March 31, 2008
Yen (millions)
Financial Power Product
Motorcycle Automobile Services and Other Segment Reconciling
Business Business Business Businesses Total Items Consolidated
Net sales and other operating revenue:
External customers ¥1,558,696 ¥9,489,391 ¥ 533,553 ¥421,194 ¥12,002,834 ¥ — ¥12,002,834
Intersegment — — 15,499 21,571 37,070 (37,070) —
Total 1,558,696 9,489,391 549,052 442,765 12,039,904 (37,070) 12,002,834
Cost of sales, SG&A and R&D expenses 1,407,409 8,827,726 431,254 420,406 11,086,795 (37,070) 11,049,725
Segment income 151,287 661,665 117,798 22,359 953,109 — 953,109
Equity in income of affiliates 28,035 89,521 — 1,386 118,942 — 118,942
Assets 1,240,527 5,591,311 5,907,839 330,604 13,070,281 (454,738) 12,615,543
Investments in affiliates 118,219 411,001 — 16,976 546,196 — 546,196
Depreciation and amortization 48,000 356,003 101,987 12,435 518,425 — 518,425
Capital expenditures 86,687 544,922 839,888 21,794 1,493,291 — 1,493,291
Impairment loss on long-lived assets
and goodwill — — 5,850 — 5,850 — 5,850
Provision for credit and
lease residual losses on
finance subsidiaries—receivables ¥ — ¥ — ¥ 58,011 ¥ — ¥ 58,011 ¥ — ¥ 58,011
Operating segments are defined as components of Honda’s about
which separate financial information is available that is evaluated
regularly by management in deciding how to allocate resources and
in assessing performance. The accounting policies used for these
reportable segments are consistent with the accounting policies
used in Honda’s consolidated financial statements.
60