Honda 2010 Annual Report Download - page 64
Download and view the complete annual report
Please find page 64 of the 2010 Honda annual report below. You can navigate through the pages in the report by either clicking on the pages listed below, or by using the keyword search tool below to find specific information within the annual report.-
 1
1 -
2
-
3
-
4
-
5
-
6
-
7
-
8
-
9
-
10
-
11
-
12
-
13
-
14
-
15
-
16
-
17
-
18
-
19
-
20
-
21
-
22
-
23
-
24
-
25
-
26
-
27
-
28
-
29
-
30
-
31
-
32
-
33
-
34
-
35
-
36
-
37
-
38
-
39
-
40
-
41
-
42
-
43
-
44
-
45
-
46
-
47
-
48
-
49
-
50
-
51
-
52
-
53
-
 54
54 -
 55
55 -
 56
56 -
 57
57 -
 58
58 -
 59
59 -
 60
60 -
 61
61 -
 62
62 -
 63
63 -
 64
64 -
 65
65 -
 66
66 -
 67
67 -
 68
68 -
 69
69 -
 70
70 -
 71
71 -
 72
72 -
 73
73 -
 74
74 -
75
-
76
 |
 |

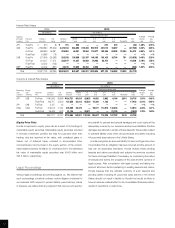
As of and for the year ended March 31, 2010
U.S. dollars (millions)
Financial Power Product
Motorcycle Automobile Services and Other Segment Reconciling
Business Business Business Businesses Total Items Consolidated
Net sales and other operating revenue:
External customers $12,256 $70,452 $ 6,517 $2,985 $ 92,210 $ — $ 92,210
Intersegment — — 134 289 423 (423) —
Total 12,256 70,452 6,651 3,274 92,633 (423) 92,210
Cost of sales, SG&A and R&D expenses 11,624 69,090 4,556 3,453 88,723 (423) 88,300
Segment income (loss) 632 1,362 2,095 (179) 3,910 — 3,910
Equity in income of affiliates 249 742 — 12 1,003 — 1,003
Assets 11,024 54,216 59,563 3,031 127,834 (2,843) 124,991
Investments in affiliates 1,107 3,599 — 181 4,887 — 4,887
Depreciation and amortization 523 3,631 2,477 137 6,768 — 6,768
Capital expenditures 412 3,059 5,872 255 9,598 — 9,598
Impairment loss on long-lived assets
and goodwill — 6 36 (1) 41 — 41
Provision for credit and
lease residual losses on
finance subsidiaries—receivables $ — $ — $ 431 $ — $ 431 $ — $ 431
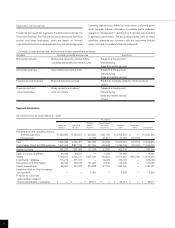
Explanatory notes:
1. Segment income (loss) is measured in a consistent manner with consolidated operating income, which is income before income taxes and
equity in income of affiliates before other income (expenses). Expenses not directly associated with specific segments are allocated based
on the most reasonable measures applicable.
2. Assets of each segment are defined as total assets, including derivative financial instruments, investments in affiliates, and deferred tax
assets. Segment assets are based on those directly associated with each segment and those not directly associated with specific segments
are allocated based on the most reasonable measures applicable except for the corporate assets described below.
3. Intersegment sales and revenues are generally made at values that approximate arm’s-length prices.
4. Unallocated corporate assets, included in reconciling items, amounted to ¥385,442 million as of March 31, 2008, ¥257,291 million as of
March 31, 2009, and ¥338,135 million ($3,634 million) as of March 31, 2010, which consist primarily of cash and cash equivalents and
marketable securities held by the Company. Reconciling items also include elimination of intersegment transactions.
5. Depreciation and amortization of the Financial Services Business include ¥101,032 million for the year ended March 31, 2008, ¥195,776
million for the year ended March 31, 2009 and ¥227,931 million ($2,450 million) for the year ended March 31, 2010 related to depreciation
of property on operating leases.
6. Capital expenditures of the Financial Services Business includes ¥839,261 million for the year ended March 31, 2008, ¥668,128 million for
the year ended March 31, 2009 and ¥544,027 million ($5,847 million) for the year ended March 31, 2010 related to purchases of operating
lease assets.
External Sales and Other Operating Revenue by Product or Service Groups
Yen U.S. dollars
(millions) (millions)
Years ended March 31: 2008 2009 2010 2010
Motorcycles and relevant parts ¥ 1,418,028 ¥ 1,323,259 ¥1,079,165 $11,599
All-terrain vehicles (ATVs), personal watercraft and relevant parts 140,668 88,252 61,127 657
Automobiles and relevant parts 9,489,391 7,674,404 6,554,848 70,452
Financial, insurance services 533,553 582,261 606,352 6,517
Power products and relevant parts 288,243 224,648 188,014 2,021
Others 132,951 118,417 89,668 964
Total ¥12,002,834 ¥10,011,241 ¥8,579,174 $92,210
62