Honda 2010 Annual Report Download - page 63
Download and view the complete annual report
Please find page 63 of the 2010 Honda annual report below. You can navigate through the pages in the report by either clicking on the pages listed below, or by using the keyword search tool below to find specific information within the annual report.-
 1
1 -
2
-
3
-
4
-
5
-
6
-
7
-
8
-
9
-
10
-
11
-
12
-
13
-
14
-
15
-
16
-
17
-
18
-
19
-
20
-
21
-
22
-
23
-
24
-
25
-
26
-
27
-
28
-
29
-
30
-
31
-
32
-
33
-
34
-
35
-
36
-
37
-
38
-
39
-
40
-
41
-
42
-
43
-
44
-
45
-
46
-
47
-
48
-
49
-
50
-
51
-
52
-
 53
53 -
 54
54 -
 55
55 -
 56
56 -
 57
57 -
 58
58 -
 59
59 -
 60
60 -
 61
61 -
 62
62 -
 63
63 -
 64
64 -
 65
65 -
 66
66 -
 67
67 -
 68
68 -
 69
69 -
 70
70 -
 71
71 -
 72
72 -
 73
73 -
74
-
75
-
76
 |
 |

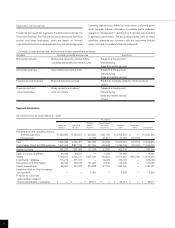
As of and for the year ended March 31, 2009
Yen (millions)
Financial Power Product
Motorcycle Automobile Services and Other Segment Reconciling
Business Business Business Businesses Total Items Consolidated
Net sales and other operating revenue:
External customers ¥1,411,511 ¥7,674,404 ¥ 582,261 ¥343,065 ¥10,011,241 ¥ — ¥10,011,241
Intersegment — — 14,264 25,840 40,104 (40,104) —
Total 1,411,511 7,674,404 596,525 368,905 10,051,345 (40,104) 10,011,241
Cost of sales, SG&A and R&D expenses 1,311,598 7,649,861 515,854 384,389 9,861,702 (40,104) 9,821,598
Segment income (loss) 99,913 24,543 80,671 (15,484) 189,643 — 189,643
Equity in income of affiliates 26,105 71,709 — 1,220 99,034 — 99,034
Assets 1,047,112 5,219,408 5,735,716 275,607 12,277,843 (458,926) 11,818,917
Investments in affiliates 107,431 379,068 — 16,247 502,746 — 502,746
Depreciation and amortization 51,200 373,295 199,324 13,825 637,644 — 637,644
Capital expenditures 90,401 523,593 671,127 16,920 1,302,041 — 1,302,041
Impairment loss on long-lived assets
and goodwill 413 18,874 18,528 2,310 40,125 — 40,125
Provision for credit and
lease residual losses on
finance subsidiaries—receivables ¥ — ¥ — ¥ 77,016 ¥ — ¥ 77,016 ¥ — ¥ 77,016
As of and for the year ended March 31, 2010
Yen (millions)
Financial Power Product
Motorcycle Automobile Services and Other Segment Reconciling
Business Business Business Businesses Total Items Consolidated
Net sales and other operating revenue:
External customers ¥1,140,292 ¥6,554,848 ¥ 606,352 ¥277,682 ¥ 8,579,174 ¥ — ¥ 8,579,174
Intersegment — — 12,459 26,936 39,395 (39,395) —
Total 1,140,292 6,554,848 618,811 304,618 8,618,569 (39,395) 8,579,174
Cost of sales, SG&A and R&D expenses 1,081,455 6,428,090 423,910 321,339 8,254,794 (39,395) 8,215,399
Segment income (loss) 58,837 126,758 194,901 (16,721) 363,775 — 363,775
Equity in income of affiliates 23,131 69,082 — 1,069 93,282 — 93,282
Assets 1,025,665 5,044,247 5,541,788 281,966 11,893,666 (264,551) 11,629,115
Investments in affiliates 103,032 334,875 — 16,821 454,728 — 454,728
Depreciation and amortization 48,683 337,787 230,453 12,751 629,674 — 629,674
Capital expenditures 38,332 284,586 546,342 23,748 893,008 — 893,008
Impairment loss on long-lived assets
and goodwill — 548 3,312 — 3,860 — 3,860
Provision for credit and
lease residual losses on
finance subsidiaries—receivables ¥— ¥ — ¥ 40,062 ¥ — ¥ 40,062 ¥ — ¥ 40,062
61