Honda 2010 Annual Report Download - page 69
Download and view the complete annual report
Please find page 69 of the 2010 Honda annual report below. You can navigate through the pages in the report by either clicking on the pages listed below, or by using the keyword search tool below to find specific information within the annual report.-
 1
1 -
2
-
3
-
4
-
5
-
6
-
7
-
8
-
9
-
10
-
11
-
12
-
13
-
14
-
15
-
16
-
17
-
18
-
19
-
20
-
21
-
22
-
23
-
24
-
25
-
26
-
27
-
28
-
29
-
30
-
31
-
32
-
33
-
34
-
35
-
36
-
37
-
38
-
39
-
40
-
41
-
42
-
43
-
44
-
45
-
46
-
47
-
48
-
49
-
50
-
51
-
52
-
53
-
54
-
55
-
56
-
57
-
58
-
 59
59 -
 60
60 -
 61
61 -
 62
62 -
 63
63 -
 64
64 -
 65
65 -
 66
66 -
 67
67 -
 68
68 -
 69
69 -
 70
70 -
 71
71 -
 72
72 -
 73
73 -
 74
74 -
 75
75 -
 76
76
 |
 |

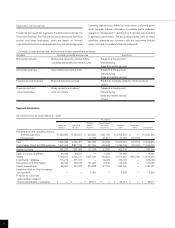
Yen (millions)
2009 2010
Non-financial Non-financial
services Finance Reconciling services Finance Reconciling
Years ended March 31, 2009 and 2010 businesses subsidiaries items Consolidated businesses subsidiaries items Consolidated
Cash flows from operating activities:
Net income ¥ 103,780 ¥ 47,153 ¥ — ¥ 150,933 ¥ 176,370 ¥ 106,241 ¥ — ¥ 282,611
Adjustments to reconcile net
income to net cash provided
by operating activities:
Depreciation 438,320 199,324 — 637,644 399,221 230,453 — 629,674
Deferred income taxes (12,547) 54,320 — 41,773 20,622 35,984 — 56,606
Equity in income of affiliates (99,034) — — (99,034) (93,282) — — (93,282)
Dividends from affiliates 65,140 — — 65,140 140,901 — — 140,901
Impairment loss on investments
in securities 26,001 — — 26,001 603 — — 603
Impairment loss on long-lived
assets and goodwill 21,597 18,528 — 40,125 548 3,312 — 3,860
Loss (gain) on derivative
instruments, net 24,045 (39,551) — (15,506) (6,683) (31,070) — (37,753)
Decrease (increase) in trade
accounts and notes receivable (55,881) 25,995 (139) (30,025) (67,982) 63,763 (2,691) (6,910)
Decrease (increase) in inventories (262,782) — — (262,782) 352,994 — — 352,994
Increase (decrease) in trade
accounts and notes payable (132,909) — (753) (133,662) 153,440 — (2,095) 151,345
Other, net (144,915) 95,425 12,524 (36,966) 22,892 28,393 12,278 63,563
Net cash provided by (used in)
operating activities (29,185) 401,194 11,632 383,641 1,099,644 437,076 7,492 1,544,212
Cash flows from investing activities:
Decrease (increase) in investments
and advances 75,714 — (68,393) 7,321 106,565 (5,878) (121,852) (21,165)
Capital expenditures (632,191) (2,999) — (635,190) (389,747) (2,315) — (392,062)
Proceeds from sales of property,
plant and equipment 18,501 342 — 18,843 24,132 340 — 24,472
Decrease (increase) in finance
subsidiaries—receivables — 45,509 (1,736) 43,773 — 87,571 4,350 91,921
Purchase of operating lease assets — (668,128) — (668,128) — (544,027) — (544,027)
Proceeds from sales of operating
lease assets — 100,017 — 100,017 — 245,110 — 245,110
Net cash used in
investing activities (537,976) (525,259) (70,129) (1,133,364) (259,050) (219,199) (117,502) (595,751)
Cash flows from financing activities:
Increase (decrease) in short-term
debt, net 452,437 (243,690) 62,048 270,795 (458,642) (304,264) 113,265 (649,641)
Proceeds from long-term debt 63,253 1,250,961 (14,230) 1,299,984 115,120 1,023,804 (6,702) 1,132,222
Repayment of long-term debt (23,165) (879,541) 13,223 (889,483) (25,285) (941,995) 3,447 (963,833)
Proceeds from issuance of
common stock — 2,544 (2,544) — — — — —
Dividends paid (139,724) — — (139,724) (61,696) — — (61,696)
Dividends paid to
noncontrolling interests (10,841) — — (10,841) (16,278) — — (16,278)
Sales (purchase) of treasury stock, net 131 — — 131 (18) — — (18)
Net cash provided by (used in)
financing activities 342,091 130,274 58,497 530,862 (446,799) (222,455) 110,010 (559,244)
Effect of exchange rate changes
on cash and cash equivalents (129,282) (12,390) — (141,672) 38,786 1,530 — 40,316
Net change in cash and
cash equivalents (354,352) (6,181) — (360,533) 432,581 (3,048) — 429,533
Cash and cash equivalents at
beginning of period 1,022,466 28,436 — 1,050,902 668,114 22,255 — 690,369
Cash and cash equivalents
at end of period ¥668,114 ¥ 22,255 ¥ — ¥ 690,369 ¥1,100,695 ¥ 19,207 ¥ — ¥1,119,902
Notes:
1. Honda adopted the FASB Accounting Standards Codification (ASC) 810 “Consolidation”, which is a replacement of Statement of Financial Accounting Standards No. 160,
“Noncontrolling Interests in Consolidated Financial Statements – an amendment of ARB No. 51”, effective April 1, 2009. Upon the adoption of ASC 810, presentation of cash flows has
been changed.
2. Non-financial services businesses lend to finance subsidiaries. These cash flows are included in the decrease (increase) in investments and advances, increase (decrease) in short-term
debt, proceeds from long-term debt, and repayment of long-term debt. The amount of the loans to finance subsidiaries is a ¥70,937 million decrease for the fiscal year ended March 31,
2009, and a ¥121,852 million decrease for the fiscal year ended March 31, 2010, respectively.
3. Decrease (increase) in trade accounts and notes receivable for finance subsidiaries is due to the reclassification of finance subsidiaries—receivables which relate to sales of inventory in
the unaudited consolidated statements of cash flows presented above.
67
Consolidated Statements of Cash Flows Divided into
Non-Financial Services Businesses and Finance Subsidiaries