Honda 2010 Annual Report Download - page 67
Download and view the complete annual report
Please find page 67 of the 2010 Honda annual report below. You can navigate through the pages in the report by either clicking on the pages listed below, or by using the keyword search tool below to find specific information within the annual report.-
 1
1 -
2
-
3
-
4
-
5
-
6
-
7
-
8
-
9
-
10
-
11
-
12
-
13
-
14
-
15
-
16
-
17
-
18
-
19
-
20
-
21
-
22
-
23
-
24
-
25
-
26
-
27
-
28
-
29
-
30
-
31
-
32
-
33
-
34
-
35
-
36
-
37
-
38
-
39
-
40
-
41
-
42
-
43
-
44
-
45
-
46
-
47
-
48
-
49
-
50
-
51
-
52
-
53
-
54
-
55
-
56
-
 57
57 -
 58
58 -
 59
59 -
 60
60 -
 61
61 -
 62
62 -
 63
63 -
 64
64 -
 65
65 -
 66
66 -
 67
67 -
 68
68 -
 69
69 -
 70
70 -
 71
71 -
 72
72 -
 73
73 -
 74
74 -
 75
75 -
 76
76
 |
 |

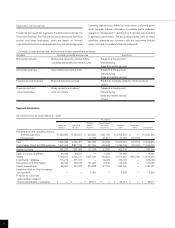
As of and for the year ended March 31, 2010
U.S dollars (millions)
North Other Reconciling
Japan America Europe Asia Regions Total Items Consolidated
Net sales and other
operating revenue:
External customers $20,040 $40,331 $8,274 $14,188 $9,377 $ 92,210 $ — $ 92,210
Transfers between
geographic areas 15,491 1,675 598 2,134 259 20,157 (20,157) —
Total 35,531 42,006 8,872 16,322 9,636 112,367 (20,157) 92,210
Cost of sales, SG&A and
R&D expenses 35,844 39,465 8,989 15,107 9,144 108,549 (20,249) 88,300
Operating income (loss) (313) 2,541 (117) 1,215 492 3,818 92 3,910
Assets 31,683 67,927 6,357 11,293 6,656 123,916 1,074 124,990
Long-lived assets $11,967 $20,009 $1,153 $ 2,587 $1,743 $ 37,459 $ — $ 37,459
Explanatory notes:
1. Major countries or regions in each geographic area:
North America United States, Canada, Mexico
Europe United Kingdom, Germany, France, Italy, Belgium
Asia Thailand, Indonesia, China, India
Other Regions Brazil, Australia
2. Operating income (loss) of each geographical region is measured in a consistent manner with consolidated operating income, which is
income before income taxes and equity in income of affiliates before other income (expenses).
3. Assets of each geographical region are defined as total assets, including derivative financial instruments, investments in affiliates, and
deferred tax assets.
4. Sales and revenues between geographic areas are generally made at values that approximate arm’s-length prices.
5. Unallocated corporate assets, included in reconciling items, amounted to ¥385,442 million as of March 31, 2008, ¥257,291 million as of
March 31, 2009, and ¥338,135 million as of March 31, 2010, which consist primarily of cash and cash equivalents and marketable securities
held by the Company. Reconciling items also include elimination of transactions between geographic areas.
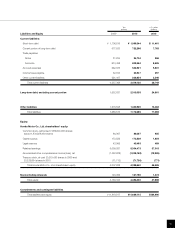
Basis of Translating Financial Statements
The consolidated financial statements are expressed in Japanese yen. However, the consolidated financial statements as of and for the year
ended March 31, 2010 have been translated into United States dollars at the rate of ¥93.04 = U.S.$1, the approximate exchange rate
prevailing on the Tokyo Foreign Exchange Market on March 31, 2010. Those U.S. dollar amounts presented in the consolidated financial
statements and related notes are included solely for the reader. This translation should not be construed as a representation that all the
amounts shown could be converted into U.S. dollars.
65