Honda 2010 Annual Report Download - page 14
Download and view the complete annual report
Please find page 14 of the 2010 Honda annual report below. You can navigate through the pages in the report by either clicking on the pages listed below, or by using the keyword search tool below to find specific information within the annual report.-
 1
1 -
2
-
3
-
 4
4 -
 5
5 -
 6
6 -
 7
7 -
 8
8 -
 9
9 -
 10
10 -
 11
11 -
 12
12 -
 13
13 -
 14
14 -
 15
15 -
 16
16 -
 17
17 -
 18
18 -
 19
19 -
 20
20 -
 21
21 -
 22
22 -
 23
23 -
 24
24 -
25
-
26
-
27
-
28
-
29
-
30
-
31
-
32
-
33
-
34
-
35
-
36
-
37
-
38
-
39
-
40
-
41
-
42
-
43
-
44
-
45
-
46
-
47
-
48
-
49
-
50
-
51
-
52
-
53
-
54
-
55
-
56
-
57
-
58
-
59
-
60
-
61
-
62
-
63
-
64
-
65
-
66
-
67
-
68
-
69
-
70
-
71
-
72
-
73
-
74
-
75
-
76
 |
 |

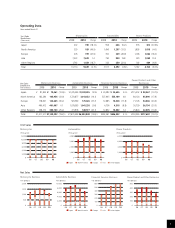
Thousands Years ended March 31
12,000
8,000
4,000
0
06 07 08 09 10
Japan North America Europe Asia Other Regions
Years ended March 31
2,000
1,500
1,000
500
0
06 07 08 09 10
Yen (billions)
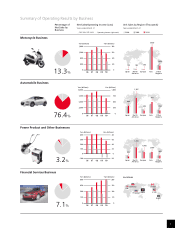
13.3%
Unit Sales Thousands 2009 2010 % change
Japan 232 190 (18.1)%
North America 320 189 (40.9)
Europe 276 199 (27.9)
Asia 7,523 7,628 1.4
Other Regions 1,763 1,433 (18.7)
Total 10,114 9,639 (4.7)%
Net Sales Yen (millions) 2009 2010 % change
Japan ¥ 81,822 ¥ 70,461 (13.9)%
North America 182,284 103,956 (43.0)
Europe 178,621 124,665 (30.2)
Asia 460,412 461,067 0.1
Other Regions 508,372 380,143 (25.2)
Total ¥1,411,511 ¥1,140,292 (19.2)%
Motorcycle Business
Percentage of Net Sales by Business Unit Sales Net Sales
Years ended March 31
Review of Operations
12