Honda 2010 Annual Report Download - page 56
Download and view the complete annual report
Please find page 56 of the 2010 Honda annual report below. You can navigate through the pages in the report by either clicking on the pages listed below, or by using the keyword search tool below to find specific information within the annual report.-
 1
1 -
2
-
3
-
4
-
5
-
6
-
7
-
8
-
9
-
10
-
11
-
12
-
13
-
14
-
15
-
16
-
17
-
18
-
19
-
20
-
21
-
22
-
23
-
24
-
25
-
26
-
27
-
28
-
29
-
30
-
31
-
32
-
33
-
34
-
35
-
36
-
37
-
38
-
39
-
40
-
41
-
42
-
43
-
44
-
45
-
 46
46 -
 47
47 -
 48
48 -
 49
49 -
 50
50 -
 51
51 -
 52
52 -
 53
53 -
 54
54 -
 55
55 -
 56
56 -
 57
57 -
 58
58 -
 59
59 -
 60
60 -
 61
61 -
 62
62 -
 63
63 -
 64
64 -
 65
65 -
 66
66 -
67
-
68
-
69
-
70
-
71
-
72
-
73
-
74
-
75
-
76
 |
 |

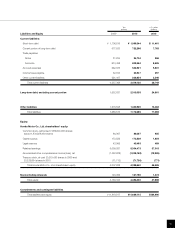
Honda Motor Co., Ltd. and Subsidiaries
March 31, 2009 and 2010
Yen U.S. dollars
(millions) (millions)
Assets 2009 2010 2010
Current assets:
Cash and cash equivalents ¥ 690,369 ¥ 1,119,902 $ 12,037
Trade accounts and notes receivable, net of allowance
for doubtful accounts of ¥7,455 million in 2009 and
¥8,555 million ($92 million) in 2010 854,214 883,476 9,496
Finance subsidiaries—receivables, net 1,172,030 1,100,158 11,825
Inventories 1,243,961 935,629 10,056
Deferred income taxes 198,158 176,604 1,898
Other current assets 462,446 397,955 4,277
Total current assets 4,621,178 4,613,724 49,589
Finance subsidiaries—receivables, net 2,400,282 2,361,335 25,380
Investments and advances:
Investments in and advances to affiliates 505,835 457,834 4,921
Other, including marketable equity securities 133,234 184,847 1,987
Total investments and advances 639,069 642,681 6,908
Property on operating leases:
Vehicles 1,557,060 1,651,672 17,752
Less accumulated depreciation 269,261 343,525 3,692
Net property on operating leases 1,287,799 1,308,147 14,060
Property, plant and equipment, at cost:
Land 469,279 489,769 5,264
Buildings 1,446,090 1,509,821 16,228
Machinery and equipment 3,133,439 3,257,455 35,011
Construction in progress 159,567 143,862 1,546
5,208,375 5,400,907 58,049
Less accumulated depreciation and amortization 3,060,654 3,314,244 35,621
Net property, plant and equipment 2,147,721 2,086,663 22,428
Other assets 722,868 616,565 6,625
Total assets ¥11,818,917 ¥11,629,115 $124,990
54
Consolidated Balance Sheets