Honda 2010 Annual Report Download - page 53
Download and view the complete annual report
Please find page 53 of the 2010 Honda annual report below. You can navigate through the pages in the report by either clicking on the pages listed below, or by using the keyword search tool below to find specific information within the annual report.-
 1
1 -
2
-
3
-
4
-
5
-
6
-
7
-
8
-
9
-
10
-
11
-
12
-
13
-
14
-
15
-
16
-
17
-
18
-
19
-
20
-
21
-
22
-
23
-
24
-
25
-
26
-
27
-
28
-
29
-
30
-
31
-
32
-
33
-
34
-
35
-
36
-
37
-
38
-
39
-
40
-
41
-
42
-
 43
43 -
 44
44 -
 45
45 -
 46
46 -
 47
47 -
 48
48 -
 49
49 -
 50
50 -
 51
51 -
 52
52 -
 53
53 -
 54
54 -
 55
55 -
 56
56 -
 57
57 -
 58
58 -
 59
59 -
 60
60 -
 61
61 -
 62
62 -
 63
63 -
64
-
65
-
66
-
67
-
68
-
69
-
70
-
71
-
72
-
73
-
74
-
75
-
76
 |
 |

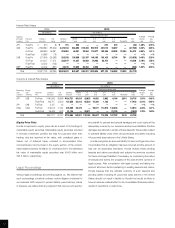
Finance Subsidiaries—Receivables
2009 2010
Yen (millions) Yen (millions)
Expected maturity date Average
Fair Within 1-2 2-3 3-4 4-5 Fair interest
Total value Total 1 year year year year year Thereafter value rate
Direct financing leases*1
JP¥ ¥ 24,720 — ¥ 29,401 17,702 5,997 3,341 1,650 711 — — 5.08%
US$ 199,172 — 7,349 7,349 — — — — — — 7.62%
Other 475,409 — 412,709 136,358 128,378 93,254 48,649 6,070 — — 3.15%
Total—Direct financing leases ¥ 699,301 — ¥449,459 161,409 134,375 96,595 50,299 6,781 — —
Other finance
subsidiaries—receivables:
JP¥ ¥ 450,177 445,588 ¥456,525 153,206 115,599 85,998 54,199 29,624 17,899 449,776 5.08%
US$ 2,561,667 2,481,293 2,504,187 879,316 603,330 504,849 329,515 146,556 40,621 2,536,110 5.07%
Other 504,599 499,198 617,507 291,614 152,020 97,427 54,097 18,711 3,638 625,523 6.92%
Total—Other finance
subsidiaries—receivables: ¥3,516,443 3,426,079 ¥3,578,219 1,324,136 870,949 688,274 437,811 194,891 62,158 3,611,409
Retained interest in securitizations*2 45,648 45,648 27,555 27,555
Total*3 ¥4,261,392 ¥4,055,233
*1 : Under U.S. generally accepted accounting principles, disclosure of fair values of direct financing leases is not required.
*2 : The retained interest in securitizations is accounted for as “trading” securities and is reported at fair value.
*3 : The finance subsidiaries—receivables include finance subsidiaries—receivables included in trade receivables and other assets in the consolidated balance sheets.
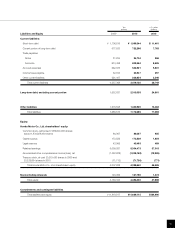
Long-Term Debt (including current portion)
2009 2010
Yen (millions) Yen (millions)
Expected maturity date Average
Fair Within 1-2 2-3 3-4 4-5 Fair interest
Total value Total 1 year year year year year Thereafter value rate
Japanese yen bonds ¥ 260,000 290,411 ¥320,000 60,000 70,000 120,000 40,000 30,000 — 323,852 1.05%
Japanese yen medium-
term notes (Fixed rate) 220,263 213,717 151,998 77,642 33,744 25,184 6,470 5,972 2,986 153,250 1.30%
Japanese yen medium-
term notes (Floating rate) 125,865 118,553 114,676 28,767 25,588 58,330 1,991 — — 114,599 0.61%
U.S. dollar medium-
term notes (Fixed rate) 390,098 359,107 391,272 48,099 32,375 46,250 135,048 50,875 78,625 420,970 5.14%
U.S. dollar medium-
term notes (Floating rate) 796,545 780,050 211,685 62,206 140,229 — — 9,250 — 213,695 3.16%
Asset-backed notes — — 311,222 119,862 117,340 74,020 — — — 316,596 2.15%
Loans and others—primarily
fixed rate 1,117,389 1,023,938 1,534,478 325,720 503,948 249,577 285,866 165,348 4,019 1,582,083 4.04%
Total ¥2,910,160 2,785,776 ¥3,035,331 722,296 923,224 573,361 469,375 261,445 85,630 3,125,045
51