Honda 2010 Annual Report Download - page 49
Download and view the complete annual report
Please find page 49 of the 2010 Honda annual report below. You can navigate through the pages in the report by either clicking on the pages listed below, or by using the keyword search tool below to find specific information within the annual report.-
 1
1 -
2
-
3
-
4
-
5
-
6
-
7
-
8
-
9
-
10
-
11
-
12
-
13
-
14
-
15
-
16
-
17
-
18
-
19
-
20
-
21
-
22
-
23
-
24
-
25
-
26
-
27
-
28
-
29
-
30
-
31
-
32
-
33
-
34
-
35
-
36
-
37
-
38
-
 39
39 -
 40
40 -
 41
41 -
 42
42 -
 43
43 -
 44
44 -
 45
45 -
 46
46 -
 47
47 -
 48
48 -
 49
49 -
 50
50 -
 51
51 -
 52
52 -
 53
53 -
 54
54 -
 55
55 -
 56
56 -
 57
57 -
 58
58 -
 59
59 -
60
-
61
-
62
-
63
-
64
-
65
-
66
-
67
-
68
-
69
-
70
-
71
-
72
-
73
-
74
-
75
-
76
 |
 |

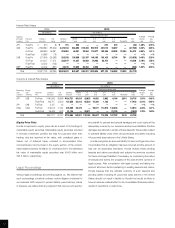
Additional Narrative of the Change in Credit Loss
The following tables summarize our allowance for credit losses on finance receivables and related information in our North American
portfolio:
Yen (billions)
For the year ended March 31, 2008 Direct financing lease Retail Wholesale Total
Provisions for credit losses
Balance at beginning of year ¥ 4.9 ¥ 23.7 ¥ 0.0 ¥ 28.7
Provision 2.1 42.7 (0.0) 44.8
Charge-offs (Net of recoveries) (4.7) (35.2) (0.0) (39.9)
Change due to securitization activity — (0.5) — (0.5)
Adjustments from foreign currency translation (0.2) (4.3) (0.0) (4.5)
Balance at end of year ¥ 2.1 ¥ 26.3 ¥ 0.0 ¥ 28.4
Ending receivable balance ¥1,019.5 ¥2,522.2 ¥348.5 ¥3,890.4
Average receivable balance, net ¥1,371.1 ¥2,616.0 ¥329.7 ¥4,317.0
Net charge-offs as a % of average receivable balance 0.34% 1.35% 0.00% 0.93%
Allowance as a % of ending receivable balance 0.21% 1.04% 0.01% 0.73%
Yen (billions)
For the year ended March 31, 2009 Direct financing lease Retail Wholesale Total
Provisions for credit losses
Balance at beginning of year ¥ 2.1 ¥ 26.3 ¥ 0.0 ¥ 28.4
Provision 3.0 45.9 0.8 49.7
Charge-offs (Net of recoveries) (3.7) (40.3) (0.3) (44.4)
Change due to securitization activity — (1.4) — (1.4)
Adjustments from foreign currency translation (0.1) (0.7) (0.0) (0.9)
Balance at end of year ¥ 1.2 ¥ 29.7 ¥ 0.4 ¥ 31.4
Ending receivable balance ¥544.2 ¥2,527.2 ¥324.9 ¥3,396.4
Average receivable balance, net ¥799.4 ¥2,745.5 ¥319.8 ¥3,864.7
Net charge-offs as a % of average receivable balance 0.47% 1.47% 0.11% 1.15%
Allowance as a % of ending receivable balance 0.23% 1.18% 0.15% 0.93%
Yen (billions)
For the year ended March 31, 2010 Direct financing lease Retail Wholesale Total
Provisions for credit losses
Balance at beginning of year ¥ 1.2 ¥ 29.7 ¥ 0.4 ¥ 31.4
Provision 1.4 25.7 0.1 27.3
Charge-offs (Net of recoveries) (1.6) (27.0) (0.1) (28.8)
Change due to securitization activity — — — —
Adjustments from foreign currency translation 0.1 (1.3) (0.0) (1.2)
Balance at end of year ¥ 1.1 ¥ 27.1 ¥ 0.4 ¥ 28.6
Ending receivable balance ¥372.9 ¥2,547.1 ¥292.1 ¥3,212.2
Average receivable balance, net ¥417.7 ¥2,490.5 ¥274.1 ¥3,182.4
Net charge-offs as a % of average receivable balance 0.41% 1.08% 0.06% 0.91%
Allowance as a % of ending receivable balance 0.30% 1.06% 0.15% 0.89%
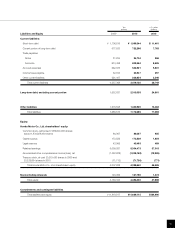
The following table provides information related to losses on operating leases due to customer defaults:
Yen (billions)
2008 2009 2010
Provision for credit losses on past due rental payments ¥0.6 ¥2.0 ¥1.9
Impairment losses on operating leases due to early termination ¥5.8 ¥8.7 ¥3.3
had experienced a 10% increase in net credit losses during fiscal
2010 in our North America portfolio, the provision for fiscal 2010 and
the allowance balance at the end of fiscal 2010 would have increased
by approximately ¥5.7 billion and ¥2.8 billion, respectively. Note that
this sensitivity analysis may be asymmetric, and are specific to the
base conditions in fiscal 2010.
47