Hasbro 2013 Annual Report Download - page 85
Download and view the complete annual report
Please find page 85 of the 2013 Hasbro annual report below. You can navigate through the pages in the report by either clicking on the pages listed below, or by using the keyword search tool below to find specific information within the annual report.-
 1
1 -
2
-
3
-
4
-
5
-
6
-
7
-
8
-
9
-
10
-
11
-
12
-
13
-
14
-
15
-
16
-
17
-
18
-
19
-
20
-
21
-
22
-
23
-
24
-
25
-
26
-
27
-
28
-
29
-
30
-
31
-
32
-
33
-
34
-
35
-
36
-
37
-
38
-
39
-
40
-
41
-
42
-
43
-
44
-
45
-
46
-
47
-
48
-
49
-
50
-
51
-
52
-
53
-
54
-
55
-
56
-
57
-
58
-
59
-
60
-
61
-
62
-
63
-
64
-
65
-
66
-
67
-
68
-
69
-
70
-
71
-
72
-
73
-
74
-
 75
75 -
 76
76 -
 77
77 -
 78
78 -
 79
79 -
 80
80 -
 81
81 -
 82
82 -
 83
83 -
 84
84 -
 85
85 -
 86
86 -
 87
87 -
 88
88 -
 89
89 -
 90
90 -
 91
91 -
 92
92 -
 93
93 -
 94
94 -
 95
95 -
96
-
97
-
98
-
99
-
100
-
101
-
102
-
103
-
104
-
105
-
106
-
107
-
108
-
109
-
110
-
111
-
112
-
113
-
114
-
115
-
116
-
117
-
118
-
119
-
120
 |
 |

HASBRO, INC. AND SUBSIDIARIES
Notes to Consolidated Financial Statements — (Continued)
(Thousands of Dollars and Shares Except Per Share Data)
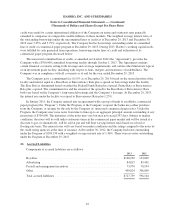
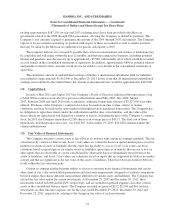
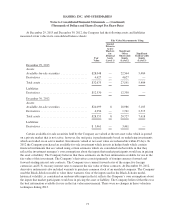
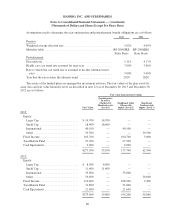
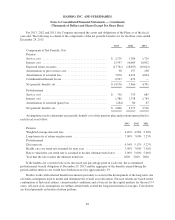
At December 29, 2013 and December 30, 2012, the Company had the following assets and liabilities
measured at fair value in its consolidated balance sheets:
Fair Value Measurements Using
Fair
Value
Quoted
Prices in
Active
Markets
for
Identical
Assets
(Level 1)
Significant
Other
Observable
Inputs
(Level 2)
Significant
Unobservable
Inputs
(Level 3)
December 29, 2013
Assets:
Available-for-sale securities .................. $28,048 — 22,564 5,484
Derivatives ................................ 4,627 — 4,627 —
Total assets ................................ $32,675 — 27,191 5,484
Liabilities:
Derivatives ................................ $12,330 — 12,330 —
December 30, 2012
Assets:
Available-for-sale securities .................. $24,099 8 18,986 5,105
Derivatives ................................ 4,254 — 1,741 2,513
Total assets ................................ $28,353 8 20,727 7,618
Liabilities:
Derivatives ................................ $ 3,461 — 3,461 —
Certain available-for-sale securities held by the Company are valued at the net asset value which is quoted
on a private market that is not active; however, the unit price is predominantly based on underlying investments
which are traded on an active market. Investments valued at net asset value are redeemable within 45 days. In
2012 the Company purchased an available-for-sale investment which invests in hedge funds which contain
financial instruments that are valued using certain estimates which are considered unobservable in that they
reflect the investment manager’s own assumptions about the inputs that market participants would use in pricing
the asset or liability. The Company believes that these estimates are the best information available for use in the
fair value of this investment. The Company’s derivatives consist primarily of foreign currency forward and
forward-starting interest rate contracts. The Company uses current forward rates of the respective foreign
currencies and U.S. treasury interest rates to measure the fair value of these contracts. At December 30, 2012,
derivative instruments also included warrants to purchase common stock of an unrelated company. The Company
used the Black-Scholes model to value these warrants. One of the inputs used in the Black-Scholes model,
historical volatility, is considered an unobservable input in that it reflects the Company’s own assumptions about
the inputs that market participants would use in pricing the asset or liability. The Company believed that this was
the best information available for use in the fair value measurement. There were no changes in these valuation
techniques during 2013.
73