Hasbro 2013 Annual Report Download - page 50
Download and view the complete annual report
Please find page 50 of the 2013 Hasbro annual report below. You can navigate through the pages in the report by either clicking on the pages listed below, or by using the keyword search tool below to find specific information within the annual report.-
 1
1 -
2
-
3
-
4
-
5
-
6
-
7
-
8
-
9
-
10
-
11
-
12
-
13
-
14
-
15
-
16
-
17
-
18
-
19
-
20
-
21
-
22
-
23
-
24
-
25
-
26
-
27
-
28
-
29
-
30
-
31
-
32
-
33
-
34
-
35
-
36
-
37
-
38
-
39
-
 40
40 -
 41
41 -
 42
42 -
 43
43 -
 44
44 -
 45
45 -
 46
46 -
 47
47 -
 48
48 -
 49
49 -
 50
50 -
 51
51 -
 52
52 -
 53
53 -
 54
54 -
 55
55 -
 56
56 -
 57
57 -
 58
58 -
 59
59 -
 60
60 -
61
-
62
-
63
-
64
-
65
-
66
-
67
-
68
-
69
-
70
-
71
-
72
-
73
-
74
-
75
-
76
-
77
-
78
-
79
-
80
-
81
-
82
-
83
-
84
-
85
-
86
-
87
-
88
-
89
-
90
-
91
-
92
-
93
-
94
-
95
-
96
-
97
-
98
-
99
-
100
-
101
-
102
-
103
-
104
-
105
-
106
-
107
-
108
-
109
-
110
-
111
-
112
-
113
-
114
-
115
-
116
-
117
-
118
-
119
-
120
 |
 |

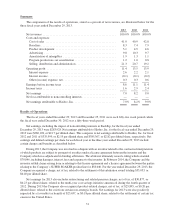
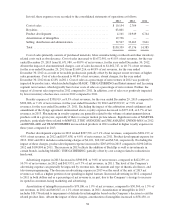
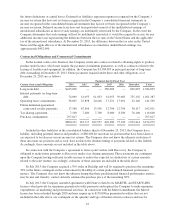
In total, these expenses were recorded to the consolidated statements of operations as follows:
2013 2012 2011
Cost of sales ............................................. $ 10,154 2,764 —
Royalties ................................................ 63,801 — —
Product development ...................................... 4,101 10,949 6,744
Amortization of intangibles ................................. 19,736 — —
Selling, distribution and administration ........................ 32,547 33,463 7,641
Total ................................................... $130,339 47,176 14,385
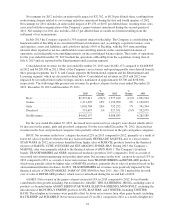
Cost of sales primarily consists of purchased materials, labor, manufacturing overheads and other inventory-
related costs such as obsolescence. Cost of sales increased to $1,672,901, or 41.0% of net revenues, for the year
ended December 29, 2013 from $1,671,980, or 40.9% of net revenues, for the year ended December 30, 2012.
Absent the impact of aforementioned charges, cost of sales decreased to $1,662,747, or 40.7% of net revenues,
for the year ended December 29, 2013 from $1,669,216, or 40.8% of net revenues, for the year ended
December 30, 2012 as a result of favorable product mix partially offset by the impact on net revenues of higher
sales promotions. Cost of sales decreased to 40.8% of net revenues, absent charges, for the year ended
December 30, 2012 from 42.8% in 2011. Cost of sales as a percentage of net revenues in 2012 was positively
impacted by product mix, which included higher MAGIC: THE GATHERING and Entertainment and Licensing
segment net revenues, which typically have lower costs of sales as a percentage of net revenues. Further, the
impact of closeout sales improved in 2012 compared to 2011. In addition, cost of sales was positively impacted
by lower inventory obsolescence costs in 2012 compared to 2011.
Royalty expense of $338,919, or 8.3% of net revenues, for the year ended December 29, 2013 compared to
$302,066, or 7.4% of net revenues, for the year ended December 30, 2012 and $339,217, or 7.9% of net
revenues, for the year ended December 25, 2011. Excluding the impact of the arbitration award settlement and
amendment of the Zynga agreement summarized above, royalty expense decreased to $275,118, or 6.7% of net
revenues, in 2013. Fluctuations in royalty expense are generally related to the volume of entertainment-driven
products sold in a given year, especially if there is a major motion picture release. Significant sales of MARVEL
products, particularly those related to MARVEL’S THE AVENGERS and THE AMAZING SPIDER-MAN, in 2012
and BEYBLADE and TRANSFORMERS movie-related products in 2011 resulted in higher royalty expenses in
those years compared to 2013.
Product development expense in 2013 totaled $207,591, or 5.1% of net revenues, compared to $201,197, or
4.9% of net revenues, in 2012 and $197,638, or 4.6% of net revenues, in 2011. Product development expense for
2013, 2012 and 2011 includes restructuring charges of $4,101, $10,949 and $6,744, respectively. Excluding the
impact of these charges, product development expense increased to $203,490 in 2013 compared to $190,248 in
2012 and $190,894 in 2011. The increase in 2013 reflects the addition of Backflip as well as investments in
certain brands, including MAGIC: THE GATHERING, partially offset by cost savings related to reduction in
headcount.
Advertising expense in 2013 decreased to $398,098, or 9.8% of net revenues, compared to $422,239, or
10.3% of net revenues, in 2012 and $413,951, or 9.7% of net revenues, in 2011. The level of the Company’s
advertising expense can generally be impacted by revenue mix, the amount and type of theatrical releases, and
television programming. The decrease in advertising expense in 2013 was the result of the mix of 2013 net
revenues as well as a higher portion of our spending in digital formats. Increased advertising in 2012 compared
to 2011 in both dollars and as a percentage of net revenue is, in part, due to the Company’s strategy to increase
its spend in consumer-facing marketing and advertising.
Amortization of intangibles increased to $78,186, or 1.9% of net revenues, compared to $50,569, or 1.3% of
net revenues, in 2012 and $46,647, or 1.1% of net revenues, in 2011. Amortization of intangibles in 2013
includes $19,736 related to impairment of definite-lived intangibles based on the Company’s decision to exit the
related product lines. Absent the impact of these charges, amortization of intangibles increased to $58,450, or
38