Hasbro 2013 Annual Report Download - page 4
Download and view the complete annual report
Please find page 4 of the 2013 Hasbro annual report below. You can navigate through the pages in the report by either clicking on the pages listed below, or by using the keyword search tool below to find specific information within the annual report.-
 1
1 -
 2
2 -
 3
3 -
 4
4 -
 5
5 -
 6
6 -
 7
7 -
 8
8 -
 9
9 -
 10
10 -
 11
11 -
 12
12 -
 13
13 -
 14
14 -
 15
15 -
16
-
17
-
18
-
19
-
20
-
21
-
22
-
23
-
24
-
25
-
26
-
27
-
28
-
29
-
30
-
31
-
32
-
33
-
34
-
35
-
36
-
37
-
38
-
39
-
40
-
41
-
42
-
43
-
44
-
45
-
46
-
47
-
48
-
49
-
50
-
51
-
52
-
53
-
54
-
55
-
56
-
57
-
58
-
59
-
60
-
61
-
62
-
63
-
64
-
65
-
66
-
67
-
68
-
69
-
70
-
71
-
72
-
73
-
74
-
75
-
76
-
77
-
78
-
79
-
80
-
81
-
82
-
83
-
84
-
85
-
86
-
87
-
88
-
89
-
90
-
91
-
92
-
93
-
94
-
95
-
96
-
97
-
98
-
99
-
100
-
101
-
102
-
103
-
104
-
105
-
106
-
107
-
108
-
109
-
110
-
111
-
112
-
113
-
114
-
115
-
116
-
117
-
118
-
119
-
120
 |
 |

2013: Focusing our Business
Our increased focus on Hasbro Franchise Brands and the
execution of our brand blueprint is evident in our 2013
results. For the year, Hasbro revenues were $4.08 billion
and, excluding charges, operating profit margin was
14.6%, both essentially flat with 2012 results.1
Hasbro’s Franchise Brands delivered revenue
growth in 2013 of 15% year-over-year and together they
represented 44% of total revenues. Franchise Brands
grew double digits in both the U.S. and Canada segment
and the International segment.
Additionally, in 2013, our investment in Emerging
Markets continued to deliver double-digit revenue
growth for Hasbro in these markets. In 2013, our
Emerging Market revenue grew 25% to $575 million or
14% of Hasbro’s revenues globally. Emerging Market
growth helped deliver higher revenues in all Hasbro’s
major international regions: Europe, Latin America and
Asia Pacific.
Profitability in the Emerging Markets also increased,
growing more than 40% year-over-year to 10.1%
operating profit margin versus 8.9% in 2012. This
improvement is the result of strong top-line growth
driven by the execution of our brand blueprint, as
we begin leveraging our investments in these higher
growth markets. We believe over time these margins will
improve to approach company average operating profit
margin levels.
2013, however, presented dicult comparisons given
the entertainment calendar in 2013 versus 2012 and
continued challenges in developed economies such as
the U.S. and Australia. Despite these challenges, revenues
grew in the Girls, Games and Preschool categories
osetting the decline in the Boys category following a
strong 2012 entertainment year.
We remain focused on growing our profitability
faster than revenues over time. Throughout Hasbro,
we have been actively implementing our cost savings
initiative to deliver $100 million in underlying cost savings
by the end of 2015. From a strategic perspective this
program focuses our eorts on fewer brand initiatives
while we tactically streamline the organization, exit
unprofitable brands, license out select brands and build
Hasbro’s global team orientation. In 2013, we incurred
a number of restructuring and other charges, mostly
associated with the transformation of our business, but
we are better positioned today to deliver long-term
profitable growth in our business and enhanced total
shareholder return.
Our balance sheet remained strong and in 2013 we
generated $401 million in operating cash flow. We are
committed to strategically investing in our business and
returning excess cash to our shareholders through our
dividend and buyback programs.
In February 2014, we announced an increase in
our quarterly dividend of $0.03 per share, or 8%, to
$0.43 per share. This is the 10th increase in 11 years and
fifth consecutive year with an increase in our dividend.
In fact, over the last decade our quarterly dividend has
grown from $0.06 per share to its current rate of $0.43
per share.
Additionally, in August 2013, the Board of Directors
authorized the Company to repurchase an additional
$500 million of our common stock. $524.8 million
remained available at year-end in current share
repurchase authorizations.
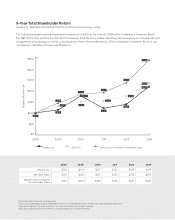
Over the past five years, we’ve returned $2.1 billion
to you, our shareholders, through our dividend and
buyback programs. This represented 121% of our net
earnings during this period and, after investing in our
business, remains our top priority for use of excess cash.
Our target remains to generate $500 million in
operating cash flow on average per year. In 2013,
operating cash flow would have exceeded $500
million if not for $125 million in long-term royalty
advances we paid during the year as we extended our
strategic merchandising relationship with The Walt
Disney Company.
Revolution Across Geographies
The Revolution in Play we are creating begins with a
Revolution in Geography, where we have significantly
invested in establishing and orienting Hasbro globally.
We are turning the pyramid of global growth on its
head, investing in emerging markets to achieve double-
digit growth, improving our execution in developing
ANNUAL 2013 REPORT