Hasbro 2013 Annual Report Download - page 101
Download and view the complete annual report
Please find page 101 of the 2013 Hasbro annual report below. You can navigate through the pages in the report by either clicking on the pages listed below, or by using the keyword search tool below to find specific information within the annual report.-
 1
1 -
2
-
3
-
4
-
5
-
6
-
7
-
8
-
9
-
10
-
11
-
12
-
13
-
14
-
15
-
16
-
17
-
18
-
19
-
20
-
21
-
22
-
23
-
24
-
25
-
26
-
27
-
28
-
29
-
30
-
31
-
32
-
33
-
34
-
35
-
36
-
37
-
38
-
39
-
40
-
41
-
42
-
43
-
44
-
45
-
46
-
47
-
48
-
49
-
50
-
51
-
52
-
53
-
54
-
55
-
56
-
57
-
58
-
59
-
60
-
61
-
62
-
63
-
64
-
65
-
66
-
67
-
68
-
69
-
70
-
71
-
72
-
73
-
74
-
75
-
76
-
77
-
78
-
79
-
80
-
81
-
82
-
83
-
84
-
85
-
86
-
87
-
88
-
89
-
90
-
 91
91 -
 92
92 -
 93
93 -
 94
94 -
 95
95 -
 96
96 -
 97
97 -
 98
98 -
 99
99 -
 100
100 -
 101
101 -
 102
102 -
 103
103 -
 104
104 -
 105
105 -
 106
106 -
 107
107 -
 108
108 -
 109
109 -
 110
110 -
 111
111 -
112
-
113
-
114
-
115
-
116
-
117
-
118
-
119
-
120
 |
 |

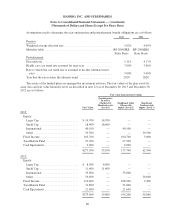
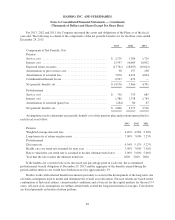
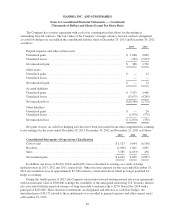
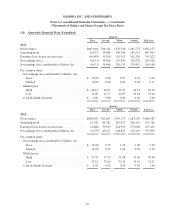
HASBRO, INC. AND SUBSIDIARIES
Notes to Consolidated Financial Statements — (Continued)
(Thousands of Dollars and Shares Except Per Share Data)
Information by segment and a reconciliation to reported amounts are as follows:
Revenues
from
External
Customers
Affiliate
Revenue
Operating
Profit
(Loss)
Depreciation
and
Amortization
Capital
Additions
Total
Assets
2013
U.S. and Canada ................ $2,006,079 4,412 313,746 21,459 553 3,066,301
International ................... 1,872,980 401 235,482 25,036 13,908 2,233,115
Entertainment and Licensing ...... 190,955 20,521 45,476 22,647 468 691,795
Global Operations(a) ............ 12,143 1,508,303 6,712 65,477 62,696 2,172,816
Corporate and eliminations(b) ..... — (1,533,637) (134,323) 46,366 34,406 (3,761,760)
Consolidated Total .............. $4,082,157 — 467,093 180,985 112,031 4,402,267
2012
U.S. and Canada ................ $2,116,297 5,309 319,072 24,899 629 6,041,893
International ................... 1,782,119 381 215,489 21,534 5,000 2,176,021
Entertainment and Licensing ...... 181,430 10,559 53,191 16,123 1,064 1,164,715
Global Operations(a) ............ 9,137 1,480,582 (15,964) 66,053 61,770 2,493,976
Corporate and eliminations(b) ..... — (1,496,831) (20,003) 21,678 43,628 (7,551,218)
Consolidated Total .............. $4,088,983 — 551,785 150,287 112,091 4,325,387
2011
U.S. and Canada ................ $2,253,458 16,259 278,356 24,389 1,199 5,225,099
International ................... 1,861,901 201 270,578 21,348 4,296 2,062,928
Entertainment and Licensing ...... 162,233 883 42,784 13,822 3,365 1,022,008
Global Operations(a) ............ 7,997 1,628,852 (7,948) 77,883 70,956 1,974,951
Corporate and eliminations(b) ..... — (1,646,195) 10,211 23,026 19,586 (6,154,212)
Consolidated Total .............. $4,285,589 — 593,981 160,468 99,402 4,130,774
(a) The Global Operations segment derives substantially all of its revenues, and thus its operating results, from
intersegment activities.
(b) Certain long-term assets, including property, plant and equipment, goodwill and other intangibles, which
benefit multiple operating segments, are included in Corporate and eliminations. Allocations of certain
expenses related to these assets to the individual operating segments are done at the beginning of the year
based on budgeted amounts. Any differences between actual and budgeted amounts are reflected in Corporate
and eliminations. Corporate and eliminations also includes the elimination of inter-company balance sheet
amounts. During 2013, certain inter-company balances were settled between each of the U.S. and Canada
segment, Entertainment and Licensing segement and Corporate and eliminations. This reduced the amount of
reported total assets of the U.S. and Canada and Entertainment and Licensing segments and increased the
amount reported in Corporate and eliminations at year-end 2013 compared to year-end 2012 and 2011.
89