Hasbro 2013 Annual Report Download - page 102
Download and view the complete annual report
Please find page 102 of the 2013 Hasbro annual report below. You can navigate through the pages in the report by either clicking on the pages listed below, or by using the keyword search tool below to find specific information within the annual report.-
 1
1 -
2
-
3
-
4
-
5
-
6
-
7
-
8
-
9
-
10
-
11
-
12
-
13
-
14
-
15
-
16
-
17
-
18
-
19
-
20
-
21
-
22
-
23
-
24
-
25
-
26
-
27
-
28
-
29
-
30
-
31
-
32
-
33
-
34
-
35
-
36
-
37
-
38
-
39
-
40
-
41
-
42
-
43
-
44
-
45
-
46
-
47
-
48
-
49
-
50
-
51
-
52
-
53
-
54
-
55
-
56
-
57
-
58
-
59
-
60
-
61
-
62
-
63
-
64
-
65
-
66
-
67
-
68
-
69
-
70
-
71
-
72
-
73
-
74
-
75
-
76
-
77
-
78
-
79
-
80
-
81
-
82
-
83
-
84
-
85
-
86
-
87
-
88
-
89
-
90
-
91
-
 92
92 -
 93
93 -
 94
94 -
 95
95 -
 96
96 -
 97
97 -
 98
98 -
 99
99 -
 100
100 -
 101
101 -
 102
102 -
 103
103 -
 104
104 -
 105
105 -
 106
106 -
 107
107 -
 108
108 -
 109
109 -
 110
110 -
 111
111 -
 112
112 -
113
-
114
-
115
-
116
-
117
-
118
-
119
-
120
 |
 |

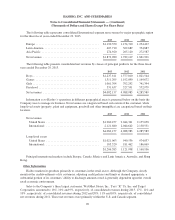
HASBRO, INC. AND SUBSIDIARIES
Notes to Consolidated Financial Statements — (Continued)
(Thousands of Dollars and Shares Except Per Share Data)
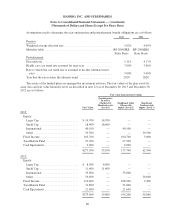
The following table represents consolidated International segment net revenues by major geographic region
for the three fiscal years ended December 29, 2013.
2013 2012 2011
Europe ........................................... $1,190,350 1,154,310 1,254,427
Latin America ..................................... 407,710 362,689 334,887
Asia Pacific ....................................... 274,920 265,120 272,587
Net revenues ...................................... $1,872,980 1,782,119 1,861,901
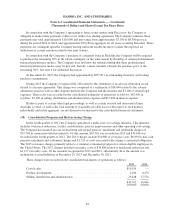
The following table presents consolidated net revenues by classes of principal products for the three fiscal
years ended December 29, 2013.
2013 2012 2011
Boys ............................................. $1,237,611 1,577,010 1,821,544
Games ........................................... 1,311,205 1,192,090 1,169,672
Girls ............................................. 1,001,704 792,292 741,394
Preschool ......................................... 531,637 527,591 552,979
Net revenues ...................................... $4,082,157 4,088,983 4,285,589
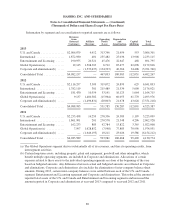
Information as to Hasbro’s operations in different geographical areas is presented below on the basis the
Company uses to manage its business. Net revenues are categorized based on location of the customer, while
long-lived assets (property, plant and equipment, goodwill and other intangibles) are categorized based on their
location.
2013 2012 2011
Net revenues
United States .................................... $1,960,477 2,044,341 2,155,038
International .................................... 2,121,680 2,044,642 2,130,551
$4,082,157 4,088,983 4,285,589
Long-lived assets
United States .................................... $1,021,063 940,536 974,037
International .................................... 185,520 181,462 186,069
$1,206,583 1,121,998 1,160,106
Principal international markets include Europe, Canada, Mexico and Latin America, Australia, and Hong
Kong.
Other Information
Hasbro markets its products primarily to customers in the retail sector. Although the Company closely
monitors the creditworthiness of its customers, adjusting credit policies and limits as deemed appropriate, a
substantial portion of its customers’ ability to discharge amounts owed is generally dependent upon the overall
retail economic environment.
Sales to the Company’s three largest customers, Wal-Mart Stores, Inc., Toys “R” Us, Inc. and Target
Corporation, amounted to 16%, 10% and 9%, respectively, of consolidated revenues during 2013, 17%, 11% and
10%, respectively, of consolidated revenues during 2012 and 20%, 11% and 10%, respectively, of consolidated
net revenues during 2011. These net revenues were primarily within the U.S. and Canada segment.
90