Hasbro 2013 Annual Report Download - page 47
Download and view the complete annual report
Please find page 47 of the 2013 Hasbro annual report below. You can navigate through the pages in the report by either clicking on the pages listed below, or by using the keyword search tool below to find specific information within the annual report.-
 1
1 -
2
-
3
-
4
-
5
-
6
-
7
-
8
-
9
-
10
-
11
-
12
-
13
-
14
-
15
-
16
-
17
-
18
-
19
-
20
-
21
-
22
-
23
-
24
-
25
-
26
-
27
-
28
-
29
-
30
-
31
-
32
-
33
-
34
-
35
-
36
-
 37
37 -
 38
38 -
 39
39 -
 40
40 -
 41
41 -
 42
42 -
 43
43 -
 44
44 -
 45
45 -
 46
46 -
 47
47 -
 48
48 -
 49
49 -
 50
50 -
 51
51 -
 52
52 -
 53
53 -
 54
54 -
 55
55 -
 56
56 -
 57
57 -
58
-
59
-
60
-
61
-
62
-
63
-
64
-
65
-
66
-
67
-
68
-
69
-
70
-
71
-
72
-
73
-
74
-
75
-
76
-
77
-
78
-
79
-
80
-
81
-
82
-
83
-
84
-
85
-
86
-
87
-
88
-
89
-
90
-
91
-
92
-
93
-
94
-
95
-
96
-
97
-
98
-
99
-
100
-
101
-
102
-
103
-
104
-
105
-
106
-
107
-
108
-
109
-
110
-
111
-
112
-
113
-
114
-
115
-
116
-
117
-
118
-
119
-
120
 |
 |

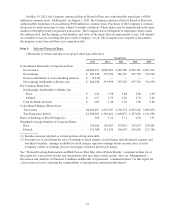
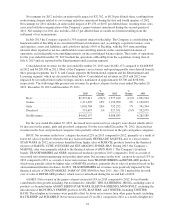
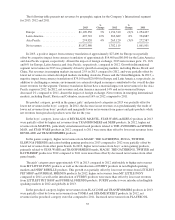
The following table presents net revenues by geographic region for the Company’s International segment
for 2013, 2012 and 2011.
2013
%
Change 2012
%
Change 2011
Europe .......................... $1,190,350 3% 1,154,310 (8)% 1,254,427
Latin America ..................... 407,710 12% 362,689 8% 334,887
Asia Pacific ...................... 274,920 4% 265,120 (3)% 272,587
Net revenues ...................... $1,872,980 1,782,119 1,861,901
In 2013, a positive impact from currency translation of approximately $27,400 for Europe was partially
offset by a negative impact from currency translation of approximately $14,400 and $6,000 for the Latin America
and Asia Pacific regions, respectively. Absent the impact of foreign exchange, 2013 net revenues grew 1%, 16%
and 6% for Europe, Latin America and Asia Pacific, respectively, compared to 2012. Growth in International
segment net revenues in 2013 was primarily driven by growth in emerging markets, including Russia, Brazil and
China. Net revenues in emerging markets increased 25% in 2013 compared to 2012, and were partially offset by
lower net revenues in certain developed markets including Australia, France and the United Kingdom. In 2012, a
negative impact from currency translation of $79,100 and $20,000 for Europe and Latin America, respectively, in
addition to challenging economic environments in certain developed economies contributed to the overall decline
in net revenues for the segment. Currency translation did not have a material impact on net revenues for the Asia
Pacific region in 2012. In 2012, net revenues in Latin America increased 14% and net revenues in Europe
decreased 2% compared to 2011, absent the impact of foreign exchange. Net revenues in emerging international
markets, including Brazil, Russia and Colombia, increased 16% in 2012 compared to 2011.
By product category, growth in the games, girls’ and preschool categories in 2013 was partially offset by
lower net revenues in the boys’ category. In 2012, the decrease in net revenues was predominantly the result of
lower net revenues from boys’ products and marginally lower net revenues from games and girls products while
net revenues from preschool products were flat for the year.
In the boys’ category, lower sales of BEYBLADE, MARVEL, STAR WARS and KRE-O products in 2013
were partially offset by higher net revenues from TRANSFROMERS and NERF products. In 2012, higher net
revenues from MARVEL, particularly entertainment-based products related to THE AVENGERS and SPIDER-
MAN, and STAR WARS products in 2012 compared to 2011 were more than offset by lower net revenues from
BEYBLADE and TRANSFORMERS products.
In the games category, higher net revenues from MAGIC: THE GATHERING, JENGA, TWISTER,
ELEFUN & FRIENDS and action battling gaming products in 2013 compared to 2012 were partially offset by
lower net revenues from other game brands. In 2012, higher net revenues from boys’ action gaming products,
primarily related to STAR WARS and TRANSFORMERS brands, MAGIC: THE GATHERING, TWISTER and
BATTLESHIP products in 2012 compared to 2011 were more than offset by decreased net revenues from other
game brands.
The girls’ category grew approximately 47% in 2013 compared to 2012 attributable to higher net revenues
from MY LITTLE PONY products as well as the introduction of FURBY products in non-English speaking
markets and NERF REBELLE products. This growth was partially offset by lower net revenues from LITTLEST
PET SHOP and FURREAL FRIENDS products. In 2012, higher net revenues from MY LITTLE PONY
compared to 2011 as well as the introduction of FURBY products were more than offset by lower net revenues
from LITTLEST PET SHOP and FURREAL FRIENDS products. FURBY products were introduced in English-
speaking markets in 2012 and globally in 2013.
In the preschool category, higher net revenues from PLAY-DOH and TRANSFORMERS products in 2013
were partially offset by lower net revenues from TONKA and SESAME STREET products. In 2012, net
revenues in the preschool category were flat compared to 2011. Increased net revenues from PLAYSKOOL
35