Hasbro 2013 Annual Report Download - page 81
Download and view the complete annual report
Please find page 81 of the 2013 Hasbro annual report below. You can navigate through the pages in the report by either clicking on the pages listed below, or by using the keyword search tool below to find specific information within the annual report.-
 1
1 -
2
-
3
-
4
-
5
-
6
-
7
-
8
-
9
-
10
-
11
-
12
-
13
-
14
-
15
-
16
-
17
-
18
-
19
-
20
-
21
-
22
-
23
-
24
-
25
-
26
-
27
-
28
-
29
-
30
-
31
-
32
-
33
-
34
-
35
-
36
-
37
-
38
-
39
-
40
-
41
-
42
-
43
-
44
-
45
-
46
-
47
-
48
-
49
-
50
-
51
-
52
-
53
-
54
-
55
-
56
-
57
-
58
-
59
-
60
-
61
-
62
-
63
-
64
-
65
-
66
-
67
-
68
-
69
-
70
-
 71
71 -
 72
72 -
 73
73 -
 74
74 -
 75
75 -
 76
76 -
 77
77 -
 78
78 -
 79
79 -
 80
80 -
 81
81 -
 82
82 -
 83
83 -
 84
84 -
 85
85 -
 86
86 -
 87
87 -
 88
88 -
 89
89 -
 90
90 -
 91
91 -
92
-
93
-
94
-
95
-
96
-
97
-
98
-
99
-
100
-
101
-
102
-
103
-
104
-
105
-
106
-
107
-
108
-
109
-
110
-
111
-
112
-
113
-
114
-
115
-
116
-
117
-
118
-
119
-
120
 |
 |

HASBRO, INC. AND SUBSIDIARIES
Notes to Consolidated Financial Statements — (Continued)
(Thousands of Dollars and Shares Except Per Share Data)
recorded a gain of $3,191 and $15,511 on these instruments in other (income) expense, net for the years ended
December 30, 2012 and December 25, 2011, respectively, relating to the change in fair value of the interest rate
swaps, wholly offsetting gains and losses from the change in fair value of the associated long-term debt.
At December 29, 2013, as detailed above, the Company’s 6.125% Notes mature in 2014 and 6.30% Notes
mature in 2017. All of the Company’s other long-term borrowings have contractual maturities that occur
subsequent to 2017. The aggregate principal amount of long-term debt maturing in the next five years is $775,000.
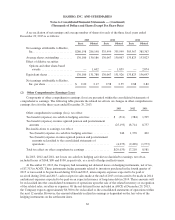
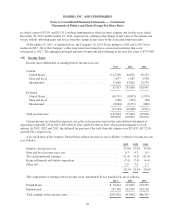
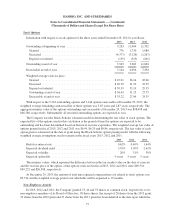
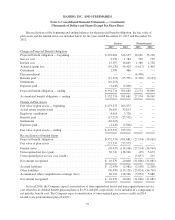
(10) Income Taxes
Income taxes attributable to earnings before income taxes are:
2013 2012 2011
Current
United States ......................................... $12,760 64,076 49,233
State and local ........................................ 1,677 1,587 2,538
International ......................................... 72,640 67,826 52,176
87,077 133,489 103,947
Deferred
United States ......................................... (10,751) (8,832) (1,973)
State and local ........................................ (368) (303) (68)
International ......................................... (8,064) (6,951) (880)
(19,183) (16,086) (2,921)
Total income taxes ...................................... $67,894 117,403 101,026
Certain income tax (benefits) expenses, not reflected in income taxes in the consolidated statements of
operations totaled $6,733 in 2013, $(31,682) in 2012 and $(18,266) in 2011 which relate primarily to stock
options. In 2013, 2012 and 2011, the deferred tax portion of the total (benefit) expense was $29,033, $(17,210)
and $(8,581), respectively.
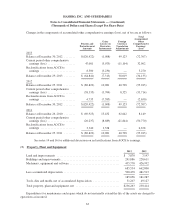
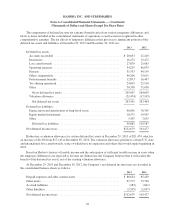
A reconciliation of the statutory United States federal income tax rate to Hasbro’s effective income tax rate
is as follows:
2013 2012 2011
Statutory income tax rate .......................................... 35.0% 35.0% 35.0%
State and local income taxes, net .................................... 0.3 0.3 0.3
Tax on international earnings ...................................... (11.4) (9.4) (11.4)
Exam settlements and statute expirations ............................. (7.4) (7.0) (4.6)
Other, net ...................................................... 2.8 7.0 1.5
19.3% 25.9% 20.8%
The components of earnings before income taxes, determined by tax jurisdiction, are as follows:
2013 2012 2011
United States .......................................... $ 54,424 113,893 132,255
International ........................................... 297,398 339,509 354,138
Total earnings before income taxes ......................... $351,822 453,402 486,393
69