Hasbro 2013 Annual Report Download - page 44
Download and view the complete annual report
Please find page 44 of the 2013 Hasbro annual report below. You can navigate through the pages in the report by either clicking on the pages listed below, or by using the keyword search tool below to find specific information within the annual report.-
 1
1 -
2
-
3
-
4
-
5
-
6
-
7
-
8
-
9
-
10
-
11
-
12
-
13
-
14
-
15
-
16
-
17
-
18
-
19
-
20
-
21
-
22
-
23
-
24
-
25
-
26
-
27
-
28
-
29
-
30
-
31
-
32
-
33
-
 34
34 -
 35
35 -
 36
36 -
 37
37 -
 38
38 -
 39
39 -
 40
40 -
 41
41 -
 42
42 -
 43
43 -
 44
44 -
 45
45 -
 46
46 -
 47
47 -
 48
48 -
 49
49 -
 50
50 -
 51
51 -
 52
52 -
 53
53 -
 54
54 -
55
-
56
-
57
-
58
-
59
-
60
-
61
-
62
-
63
-
64
-
65
-
66
-
67
-
68
-
69
-
70
-
71
-
72
-
73
-
74
-
75
-
76
-
77
-
78
-
79
-
80
-
81
-
82
-
83
-
84
-
85
-
86
-
87
-
88
-
89
-
90
-
91
-
92
-
93
-
94
-
95
-
96
-
97
-
98
-
99
-
100
-
101
-
102
-
103
-
104
-
105
-
106
-
107
-
108
-
109
-
110
-
111
-
112
-
113
-
114
-
115
-
116
-
117
-
118
-
119
-
120
 |
 |

Net earnings for 2012 includes an unfavorable impact of $32,762, or $0.26 per diluted share, resulting from
restructuring charges related to cost savings initiatives announced during the first and fourth quarters of 2012.
Net earnings for 2011 includes an unfavorable impact of $9,178, or $0.07 per diluted share, resulting from costs
associated with the reorganization of the Company’s games business announced during the second quarter of
2011. Net earnings for 2011 also includes a $0.15 per diluted share favorable tax benefit resulting from the
settlement of tax examinations.
In July 2013 the Company acquired a 70% majority interest in Backflip. The Company is consolidating the
financial results of Backflip in its consolidated financial statements and, accordingly, reported revenues, costs
and expenses, assets and liabilities, and cash flows include 100% of Backflip, with the 30% noncontrolling
interests share reported as net loss attributable to noncontrolling interests in the consolidated statements of
operations, and redeemable noncontrolling interests on the consolidated balance sheets. The results of operations
for the year ended December 29, 2013 include the operations of Backflip from the acquisition closing date of
July 8, 2013 and are reported in the Entertainment and Licensing segment.
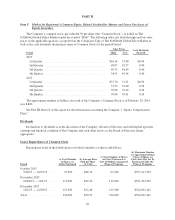
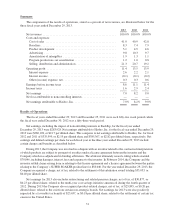
Consolidated net revenues for the year ended December 29, 2013 were $4,082,157 compared to $4,088,983
in 2012 and $4,285,589 in 2011. Most of the Company’s net revenues and operating profits were derived from its
three principal segments: the U.S. and Canada segment, the International segment and the Entertainment and
Licensing segment, which are discussed in detail below. Consolidated net revenues in 2013 and 2012 were
impacted by favorable/(unfavorable) foreign currency translation of approximately $3,700 and $(98,500),
respectively. The following table presents net revenues by product category for the years ended December 29,
2013, December 30, 2012 and December 25, 2011.
2013
%
Change 2012
%
Change 2011
Boys ............................ $1,237,611 (22)% 1,577,010 (13)% 1,821,544
Games ........................... 1,311,205 10% 1,192,090 2% 1,169,672
Girls ............................ 1,001,704 26% 792,292 7% 741,394
Preschool ........................ 531,637 1% 527,591 (5)% 552,979
Net Revenues ..................... $4,082,157 4,088,983 4,285,589
For the year ended December 29, 2013, decreased net revenues in boys category were almost wholly offset
by increases in the games, girls and preschool categories. For the year ended December 30, 2012, decreased net
revenues in the boys and preschool categories were partially offset by increases in the girls and games categories.
BOYS: Net revenues in the boys’ category decreased 22% in 2013 compared to 2012, primarily as a result of
lower net sales of products related to the key licensed brands BEYBLADE, MARVEL and, to a lesser extent,
STAR WARS. In 2012, net revenues benefited from higher sales of MARVEL products based on the theatrical
releases of MARVEL’S THE AVENGERS and THE AMAZING SPIDER-MAN. During 2013, the Company’s
MARVEL sales were primarily related to the theatrical release of IRON MAN 3. The Company’s franchise
brands, TRANSFORMERS and NERF, experienced moderate growth in 2013 compared to 2012 as a result of
successful television programming and product innovation. Net revenues in the boys’ category decreased 13% in
2012 compared to 2011 as a result of lower net revenues from TRANSFORMERS and BEYBLADE products,
which were partially offset by higher sales of MARVEL products, primarily due to sales of products based on the
aforementioned theatrical releases. In 2011, TRANSFORMERS net revenues were positively impacted by the
theatrical release of TRANSFORMERS: DARK OF THE MOON in June 2011. Also, 2011 marked the first full
year of sales of BEYBLADE products, which were re-introduced during the second half of 2010.
GAMES: Net revenues in the games category increased 10% in 2013 compared to 2012. Several brands
contributed to this growth including, but not limited to, MAGIC: THE GATHERING, JENGA, including sales of
products co-branded under ANGRY BIRDS STAR WARS, ELEFUN & FRIENDS, MONOPOLY, including the
introduction of MONOPOLY EMPIRE products, DUEL MASTERS, and TWISTER, including TWISTER
RAVE. These higher net revenues were partially offset by lower net revenues from other game brands, including
BATTLESHIP and SCRABBLE. Net revenues increased 2% in 2012 compared to 2011 as a result of higher net
32