Hasbro 2013 Annual Report Download - page 69
Download and view the complete annual report
Please find page 69 of the 2013 Hasbro annual report below. You can navigate through the pages in the report by either clicking on the pages listed below, or by using the keyword search tool below to find specific information within the annual report.-
 1
1 -
2
-
3
-
4
-
5
-
6
-
7
-
8
-
9
-
10
-
11
-
12
-
13
-
14
-
15
-
16
-
17
-
18
-
19
-
20
-
21
-
22
-
23
-
24
-
25
-
26
-
27
-
28
-
29
-
30
-
31
-
32
-
33
-
34
-
35
-
36
-
37
-
38
-
39
-
40
-
41
-
42
-
43
-
44
-
45
-
46
-
47
-
48
-
49
-
50
-
51
-
52
-
53
-
54
-
55
-
56
-
57
-
58
-
 59
59 -
 60
60 -
 61
61 -
 62
62 -
 63
63 -
 64
64 -
 65
65 -
 66
66 -
 67
67 -
 68
68 -
 69
69 -
 70
70 -
 71
71 -
 72
72 -
 73
73 -
 74
74 -
 75
75 -
 76
76 -
 77
77 -
 78
78 -
 79
79 -
80
-
81
-
82
-
83
-
84
-
85
-
86
-
87
-
88
-
89
-
90
-
91
-
92
-
93
-
94
-
95
-
96
-
97
-
98
-
99
-
100
-
101
-
102
-
103
-
104
-
105
-
106
-
107
-
108
-
109
-
110
-
111
-
112
-
113
-
114
-
115
-
116
-
117
-
118
-
119
-
120
 |
 |

HASBRO, INC. AND SUBSIDIARIES
Notes to Consolidated Financial Statements — (Continued)
(Thousands of Dollars and Shares Except Per Share Data)
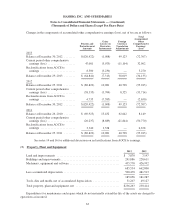
Inventories
Inventories are valued at the lower of cost (first-in, first-out) or market. Based upon a consideration of
quantities on hand, actual and projected sales volume, anticipated product selling price and product lines planned
to be discontinued, slow-moving and obsolete inventory is written down to its estimated net realizable value. At
December 29, 2013 and December 30, 2012, finished goods comprised 90% and 91% of inventories,
respectively.
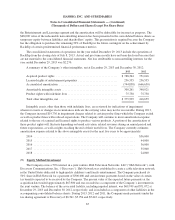
Equity Method Investment
For the Company’s equity method investments, only the Company’s investment in and amounts due to and
from the equity method investment are included in the consolidated balance sheets and only the Company’s share
of the equity method investment’s earnings (losses) is included in the consolidated statements of operations.
Dividends, cash distributions, loans or other cash received from the equity method investment, additional cash
investments, loan repayments or other cash paid to the investee are included in the consolidated statements of
cash flows.
The Company reviews its equity method investments for impairment on a periodic basis. If it has been
determined that the fair value of the equity investment is less than its related carrying value and that this decline
is other-than-temporary, the carrying value of the investment is adjusted downward to reflect these declines in
value. The Company has one significant equity method investment, its 50% interest in a joint venture with
Discovery Communications, Inc. See note 5 for additional information.
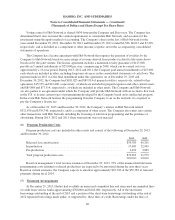
Long-Lived Assets
The Company’s long-lived assets consist of goodwill and intangible assets with indefinite lives, other
intangibles, and property, plant and equipment the Company considers to have a defined life.
Goodwill results from acquisitions the Company has made over time. Substantially all of the other
intangibles consist of the cost of acquired product rights. In establishing the value of such rights, the Company
considers existing trademarks, copyrights, patents, license agreements and other product-related rights. These
rights were valued on their acquisition date based on the anticipated future cash flows from the underlying
product line. The Company has certain intangible assets related to the Tonka and Milton Bradley acquisitions
that have an indefinite life.
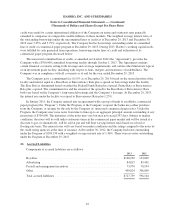
Goodwill and intangible assets deemed to have indefinite lives are not amortized and are tested for
impairment at least annually. The annual test begins with goodwill and all intangible assets being allocated to
applicable reporting units. Goodwill is then tested using a two-step process that begins with an estimation of fair
value of the reporting unit using an income approach, which looks to the present value of expected future cash
flows. The first step is a screen for potential impairment while the second step measures the amount of
impairment if there is an indication from the first step that one exists. Intangible assets with indefinite lives are
tested annually for impairment by comparing their carrying value to their estimated fair value, also calculated
using the present value of expected future cash flows.
The remaining intangibles having defined lives are being amortized over periods ranging from five to
twenty years, primarily using the straight-line method. At December 29, 2013, approximately 12% of other
intangibles, net are being amortized in proportion to projected revenues.
Property, plant and equipment are stated at cost less accumulated depreciation. Depreciation is computed
using accelerated and straight-line methods to depreciate the cost of property, plant and equipment over their
estimated useful lives. The principal lives, in years, used in determining depreciation rates of various assets are:
land improvements 15 to 19, buildings and improvements 15 to 25 and machinery and equipment 3 to 12.
57