Hasbro 2013 Annual Report Download - page 54
Download and view the complete annual report
Please find page 54 of the 2013 Hasbro annual report below. You can navigate through the pages in the report by either clicking on the pages listed below, or by using the keyword search tool below to find specific information within the annual report.-
 1
1 -
2
-
3
-
4
-
5
-
6
-
7
-
8
-
9
-
10
-
11
-
12
-
13
-
14
-
15
-
16
-
17
-
18
-
19
-
20
-
21
-
22
-
23
-
24
-
25
-
26
-
27
-
28
-
29
-
30
-
31
-
32
-
33
-
34
-
35
-
36
-
37
-
38
-
39
-
40
-
41
-
42
-
43
-
 44
44 -
 45
45 -
 46
46 -
 47
47 -
 48
48 -
 49
49 -
 50
50 -
 51
51 -
 52
52 -
 53
53 -
 54
54 -
 55
55 -
 56
56 -
 57
57 -
 58
58 -
 59
59 -
 60
60 -
 61
61 -
 62
62 -
 63
63 -
 64
64 -
65
-
66
-
67
-
68
-
69
-
70
-
71
-
72
-
73
-
74
-
75
-
76
-
77
-
78
-
79
-
80
-
81
-
82
-
83
-
84
-
85
-
86
-
87
-
88
-
89
-
90
-
91
-
92
-
93
-
94
-
95
-
96
-
97
-
98
-
99
-
100
-
101
-
102
-
103
-
104
-
105
-
106
-
107
-
108
-
109
-
110
-
111
-
112
-
113
-
114
-
115
-
116
-
117
-
118
-
119
-
120
 |
 |
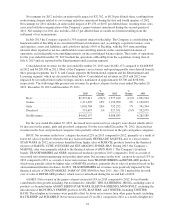
increased benefit payments due to a higher level of retirements during 2013 resulting from an early retirement
program in the United States relating to the cost savings initiative. The increase in other liabilities in 2012
compared to 2011 is primarily due to higher liabilities for pension and uncertain tax positions.
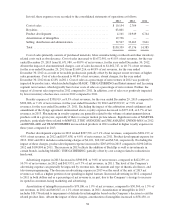
Cash flows utilized by investing activities were $217,743, $106,172 and $107,615 in 2013, 2012 and 2011,
respectively. Additions to property, plant and equipment were $112,031, $112,091 and $99,402 in 2013, 2012
and 2011, respectively. Of these additions, 51% in 2013, 45% in 2012 and 66% in 2011 were for purchases of
tools, dies and molds related to the Company’s products. In 2014, the Company expects capital expenditures to
be in the range of $125,000 to $135,000. During the three years ended December 29, 2013, the depreciation of
plant and equipment was $102,799, $99,718 and $113,821, respectively. Fluctuations in depreciation of plant and
equipment correlate with the percentage of additions to property, plant and equipment relating to tools, dies and
molds which have shorter useful lives and accelerated depreciation. Cash utilized for investments and
acquisitions was $110,698 and $11,585 in 2013 and 2011, respectively. No investments or acquisitions were
made in 2012. The 2013 utilization represents the Company’s acquisition of a majority stake in Backflip as well
as a payment related to an existing intellectual property while the 2011 utilization represents the Company’s
purchase of that same intellectual property.
The Company commits to inventory production, advertising and marketing expenditures prior to the peak
fourth quarter retail selling season. Accounts receivable increase during the third and fourth quarter as customers
increase their purchases to meet expected consumer demand in their holiday selling season. Due to the
concentrated timeframe of this selling period, payments for these accounts receivable are generally not due until
the fourth quarter or early in the first quarter of the subsequent year. This timing difference between expenditures
and cash collections on accounts receivable makes it necessary for the Company to borrow higher amounts
during the latter part of the year. During 2013, 2012 and 2011, the Company primarily used cash from operations
and borrowings under its commercial paper program and available lines of credit.
The Company has an agreement with a group of banks which provides for a commercial paper program (the
“Program”). Under the Program, at the request of the Company and subject to market conditions, the banks may
either purchase from the Company, or arrange for the sale by the Company, of unsecured commercial paper
notes. The Company may issue notes from time to time up to an aggregate principal amount outstanding at any
given time of $700,000. The maturities of the notes may vary but may not exceed 397 days. The notes are sold
under customary terms in the commercial paper market and are issued at a discount to par, or alternatively, sold
at par and bear varying interest rates based on a fixed or floating rate basis. The interest rates vary based on
market conditions and the ratings assigned to the notes by the credit rating agencies at the time of issuance.
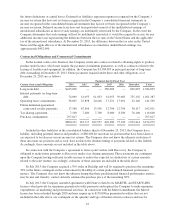
Borrowings under the Program are supported by the Company’s $700,000 revolving credit agreement. At
December 29, 2013, there were no notes outstanding related to the Program.
The Company has a revolving credit agreement (the “Agreement”) which provides the Company with a
$700,000 committed borrowing facility. The Agreement contains certain financial covenants setting forth
leverage and coverage requirements, and certain other limitations typical of an investment grade facility,
including with respect to liens, mergers and incurrence of indebtedness. The Company was in compliance with
all covenants in the Agreement as of and for the fiscal year ended December 29, 2013. The Company had no
borrowings outstanding under its committed revolving credit facility at December 29, 2013. However, letters of
credit outstanding under this facility as of December 29, 2013 were approximately $1,000. Amounts available
and unused under the committed line at December 29, 2013 were approximately $699,000. The Company also
has other uncommitted lines from various banks, of which approximately $29,600 was utilized at December 29,
2013. Of the amount utilized under, or supported by, the uncommitted lines, approximately $8,300 and $21,300
represent outstanding short-term borrowings and letters of credit, respectively.
Net cash utilized by financing activities was $341,009 in 2013 compared to $219,379 in 2012 and $375,685
in 2011. Of these amounts, $103,488, $98,005 and $423,008 reflects cash paid, including transaction costs, in
2013, 2012 and 2011, respectively, to repurchase the Company’s common stock. During 2013, 2012 and 2011,
the Company repurchased 2,268, 2,694 and 10,461 shares at an average price of $45.17, $37.11 and $40.42,
respectively. At December 29, 2013, $524,822 remained under outstanding Board authorizations. Dividends paid
were $156,129 in 2013 compared to $225,464 in 2012 and $154,028 in 2011. Dividends paid in 2012 include an
42