Hasbro 2013 Annual Report Download - page 52
Download and view the complete annual report
Please find page 52 of the 2013 Hasbro annual report below. You can navigate through the pages in the report by either clicking on the pages listed below, or by using the keyword search tool below to find specific information within the annual report.-
 1
1 -
2
-
3
-
4
-
5
-
6
-
7
-
8
-
9
-
10
-
11
-
12
-
13
-
14
-
15
-
16
-
17
-
18
-
19
-
20
-
21
-
22
-
23
-
24
-
25
-
26
-
27
-
28
-
29
-
30
-
31
-
32
-
33
-
34
-
35
-
36
-
37
-
38
-
39
-
40
-
41
-
 42
42 -
 43
43 -
 44
44 -
 45
45 -
 46
46 -
 47
47 -
 48
48 -
 49
49 -
 50
50 -
 51
51 -
 52
52 -
 53
53 -
 54
54 -
 55
55 -
 56
56 -
 57
57 -
 58
58 -
 59
59 -
 60
60 -
 61
61 -
 62
62 -
63
-
64
-
65
-
66
-
67
-
68
-
69
-
70
-
71
-
72
-
73
-
74
-
75
-
76
-
77
-
78
-
79
-
80
-
81
-
82
-
83
-
84
-
85
-
86
-
87
-
88
-
89
-
90
-
91
-
92
-
93
-
94
-
95
-
96
-
97
-
98
-
99
-
100
-
101
-
102
-
103
-
104
-
105
-
106
-
107
-
108
-
109
-
110
-
111
-
112
-
113
-
114
-
115
-
116
-
117
-
118
-
119
-
120
 |
 |

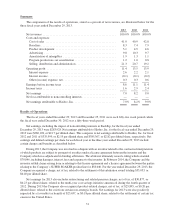
Income Taxes
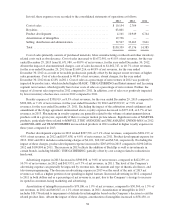
Income tax expense totaled 19.3% of pretax earnings in 2013 compared with 25.9% in 2012 and 20.8% in
2011. Income tax expense for 2013 includes net benefits of approximately $30,000 from discrete events,
primarily related to the settlement of various tax examinations in multiple jurisdictions, including the United
States. Income tax expense for 2012 includes net benefits of approximately $8,300 from discrete tax events,
primarily related to the repatriation of certain highly taxed foreign earnings and to expirations of statutes of
limitations in multiple jurisdictions. Income tax expense for 2011 is net of a benefit of approximately $29,600
from discrete tax events, primarily related to the settlement of various tax examinations in multiple jurisdictions,
including the United States. Absent these items, potential interest and penalties related to uncertain tax positions
recorded in 2013, 2012 and 2011, and the impact of the 2013 charges related to restructuring activities, exit from
certain product lines and settlement of the unfavorable arbitration award, the effective tax rates would have been
25.8%, 27.0% and 26.2%, respectively. The increase in the adjusted tax rate from 2011 to 2012 and decrease
from 2012 to 2013 primarily reflect the change in the geographic mix of where the company earned its profits.
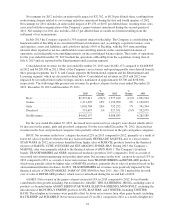
Liquidity and Capital Resources
The Company has historically generated a significant amount of cash from operations. In 2013 the Company
funded its operations and liquidity needs primarily through cash flows from operations, and, when needed, using
borrowings under its available lines of credit and its commercial paper program. During 2014, the Company
expects to continue to fund its working capital needs primarily through cash flows from operations and, when
needed, by issuing commercial paper or borrowing under its revolving credit agreement. In the event that the
Company is not able to issue commercial paper, the Company intends to utilize its available lines of credit. The
Company believes that the funds available to it, including cash expected to be generated from operations and
funds available through its commercial paper program or its available lines of credit are adequate to meet its
working capital needs for 2014, however, unexpected events or circumstances such as material operating losses
or increased capital or other expenditures, or inability to otherwise access the commercial paper market, may
reduce or eliminate the availability of external financial resources. In addition, significant disruptions to credit
markets may also reduce or eliminate the availability of external financial resources. Although the Company
believes the risk of nonperformance by the counterparties to its financial facilities is not significant, in times of
severe economic downturn in the credit markets it is possible that one or more sources of external financing may
be unable or unwilling to provide funding to the Company.
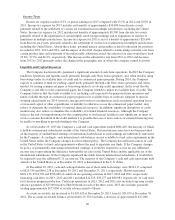
As of December 29, 2013 the Company’s cash and cash equivalents totaled $682,449, the majority of which
is held by international subsidiaries outside of the United States. Deferred income taxes have not been provided
on the majority of undistributed earnings of international subsidiaries as such earnings are indefinitely reinvested
by the Company. Accordingly, such international cash balances are not available to fund cash requirements in the
United States unless the Company changes its reinvestment policy. The Company has sufficient sources of cash
in the United States to fund cash requirements without the need to repatriate any funds. If the Company changes
its policy of permanently reinvesting international earnings, it would be required to accrue for any additional
income taxes representing the difference between the tax rates in the United States and the applicable tax of the
international subsidiaries. If the Company repatriated the funds from its international subsidiaries, it would then
be required to pay the additional U.S. income tax. The majority of the Company’s cash and cash equivalents held
outside of the United States as of December 29, 2013 is denominated in the U.S. dollar.
At December 29, 2013, cash and cash equivalents, net of short-term borrowings, were $674,117 compared
to $625,336 and $461,258 at December 30, 2012 and December 25, 2011, respectively. Hasbro generated
$401,132, $534,796 and $396,069 of cash from its operating activities in 2013, 2012 and 2011, respectively.
Operating cash flows in 2013, 2012 and 2011 included $41,325, $59,277 and $80,983, respectively, of cash used
for television program production. Cash from operations in 2013, 2012 and 2011 also includes long-term royalty
advance payments of $25,000 made to Hub Network in each of the three years. 2013 also includes payments
totaling approximately $175,000 of royalty advances paid to Disney.
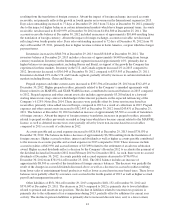
Accounts receivable, net increased to $1,093,620 at December 29, 2013 from $1,029,959 at December 30,
2012. The accounts receivable balance at December 29, 2013 includes a decrease of approximately $17,000
40