Hasbro 2013 Annual Report Download - page 104
Download and view the complete annual report
Please find page 104 of the 2013 Hasbro annual report below. You can navigate through the pages in the report by either clicking on the pages listed below, or by using the keyword search tool below to find specific information within the annual report.-
 1
1 -
2
-
3
-
4
-
5
-
6
-
7
-
8
-
9
-
10
-
11
-
12
-
13
-
14
-
15
-
16
-
17
-
18
-
19
-
20
-
21
-
22
-
23
-
24
-
25
-
26
-
27
-
28
-
29
-
30
-
31
-
32
-
33
-
34
-
35
-
36
-
37
-
38
-
39
-
40
-
41
-
42
-
43
-
44
-
45
-
46
-
47
-
48
-
49
-
50
-
51
-
52
-
53
-
54
-
55
-
56
-
57
-
58
-
59
-
60
-
61
-
62
-
63
-
64
-
65
-
66
-
67
-
68
-
69
-
70
-
71
-
72
-
73
-
74
-
75
-
76
-
77
-
78
-
79
-
80
-
81
-
82
-
83
-
84
-
85
-
86
-
87
-
88
-
89
-
90
-
91
-
92
-
93
-
 94
94 -
 95
95 -
 96
96 -
 97
97 -
 98
98 -
 99
99 -
 100
100 -
 101
101 -
 102
102 -
 103
103 -
 104
104 -
 105
105 -
 106
106 -
 107
107 -
 108
108 -
 109
109 -
 110
110 -
 111
111 -
 112
112 -
 113
113 -
 114
114 -
115
-
116
-
117
-
118
-
119
-
120
 |
 |

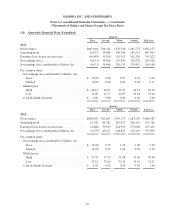
HASBRO, INC. AND SUBSIDIARIES
Notes to Consolidated Financial Statements — (Continued)
(Thousands of Dollars and Shares Except Per Share Data)
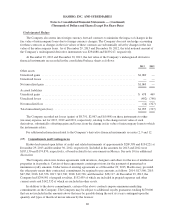
(20) Quarterly Financial Data (Unaudited)
Quarter
First Second Third Fourth Full Year
2013
Net revenues ................................ $663,694 766,342 1,370,348 1,281,773 4,082,157
Operating profit .............................. 10,627 74,088 198,706 183,672 467,093
Earnings (loss) before income taxes .............. (16,493) 51,076 155,913 161,326 351,822
Net earnings (loss) ............................ (6,671) 36,480 125,843 128,276 283,928
Net earnings (loss) attributable to Hasbro, Inc. ...... (6,671) 36,480 126,574 129,815 286,198
Per common share
Net earnings (loss) attributable to Hasbro, Inc.
Basic .................................. $ (0.05) 0.28 0.97 0.99 2.20
Diluted ................................. (0.05) 0.28 0.96 0.98 2.17
Market price
High ................................... $ 44.14 48.97 49.75 54.55 54.55
Low ................................... 35.00 42.57 44.69 45.44 35.00
Cash dividends declared ..................... $ 0.40 0.40 0.40 0.40 1.60
Quarter
First Second Third Fourth Full Year
2012
Net revenues ................................ $648,850 811,467 1,345,137 1,283,529 4,088,983
Operating profit .............................. 15,726 86,282 249,622 200,155 551,785
Earnings (loss) before income taxes .............. (4,866) 59,659 224,949 173,660 453,402
Net earnings (loss) attributable to Hasbro, Inc. ...... (2,579) 43,427 164,852 130,299 335,999
Per common share
Net earnings (loss) attributable to Hasbro, Inc.
Basic .................................. $ (0.02) 0.33 1.26 1.00 2.58
Diluted ................................. (0.02) 0.33 1.24 0.99 2.55
Market price
High ................................... $ 37.70 37.55 39.98 39.96 39.98
Low ................................... 31.51 32.00 32.29 34.91 31.51
Cash dividends declared ..................... $ 0.36 0.36 0.36 0.36 1.44
92