Hasbro 2013 Annual Report Download - page 45
Download and view the complete annual report
Please find page 45 of the 2013 Hasbro annual report below. You can navigate through the pages in the report by either clicking on the pages listed below, or by using the keyword search tool below to find specific information within the annual report.-
 1
1 -
2
-
3
-
4
-
5
-
6
-
7
-
8
-
9
-
10
-
11
-
12
-
13
-
14
-
15
-
16
-
17
-
18
-
19
-
20
-
21
-
22
-
23
-
24
-
25
-
26
-
27
-
28
-
29
-
30
-
31
-
32
-
33
-
34
-
 35
35 -
 36
36 -
 37
37 -
 38
38 -
 39
39 -
 40
40 -
 41
41 -
 42
42 -
 43
43 -
 44
44 -
 45
45 -
 46
46 -
 47
47 -
 48
48 -
 49
49 -
 50
50 -
 51
51 -
 52
52 -
 53
53 -
 54
54 -
 55
55 -
56
-
57
-
58
-
59
-
60
-
61
-
62
-
63
-
64
-
65
-
66
-
67
-
68
-
69
-
70
-
71
-
72
-
73
-
74
-
75
-
76
-
77
-
78
-
79
-
80
-
81
-
82
-
83
-
84
-
85
-
86
-
87
-
88
-
89
-
90
-
91
-
92
-
93
-
94
-
95
-
96
-
97
-
98
-
99
-
100
-
101
-
102
-
103
-
104
-
105
-
106
-
107
-
108
-
109
-
110
-
111
-
112
-
113
-
114
-
115
-
116
-
117
-
118
-
119
-
120
 |
 |

revenues from MAGIC: THE GATHERING, BATTLESHIP and TWISTER, as well as the introduction of boys’
action gaming products, which included STAR WARS FIGHTER PODS, ANGRY BIRDS STAR WARS and
TRANSFORMERS BOT SHOTS. These higher net revenues were partially offset by lower net revenues from
other game brands, including SCRABBLE, CONNECT 4 and YAHTZEE.
GIRLS: Net revenues in the girls’ category increased 26% in 2013 compared to 2012, primarily related to
higher net revenues from MY LITTLE PONY, FURBY and NERF REBELLE products. Net revenues from MY
LITTLE PONY products have gained momentum with support from the successful television program, MY
LITTLE PONY: FRIENDSHIP IS MAGIC, as well as the third quarter 2013 introduction of MY LITTLE PONY
EQUESTRIA GIRLS fashion doll products which was supported by the release of an animated movie in summer
of 2013. Also, 2013 was the first full year of net revenues from FURBY products including the introduction of
FURBY in non-English speaking markets. Lastly, NERF REBELLE, a line of action performance products, was
successfully launched during the second half of 2013. These higher net revenues were partially offset by lower
net revenues from LITTLEST PET SHOP and FURREAL FRIENDS products. Net revenues in the girls’
category increased 7% in 2012 compared to 2011 primarily due to new initiatives including the introduction of
FURBY in English-speaking markets as well as ONE DIRECTION products. Higher net revenues from MY
LITTLE PONY products, supported by the aforementioned television programming, also contributed to growth
in the girls’ category. These higher net revenues were partially offset by decreased net revenues from LITTLEST
PET SHOP, FURREAL FRIENDS and STRAWBERRY SHORTCAKE products.
PRESCHOOL: Net revenues in the preschool category increased 1% in 2013 compared to 2012. Higher net
revenues from PLAY-DOH, PLAYSKOOL HEROES, specifically TRANSFORMERS RESCUE BOTS, and
SESAME STREET, including BIG HUGS ELMO, products were almost wholly offset by lower net revenues
from TONKA and PLAYSKOOL products. In 2013, the Company elected to out-license the distribution of
TONKA products to a third-party, thereby earning licensing revenue in 2013 compared to wholesale revenue in
2012. Net revenues in the preschool category decreased 5% in 2012 compared to 2011. Increased net revenues
from PLAY-DOH were more than offset by declines in SESAME STREET and TONKA products.
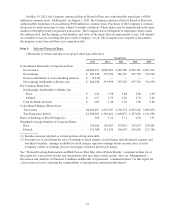
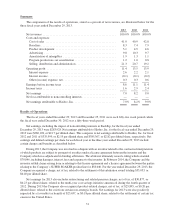
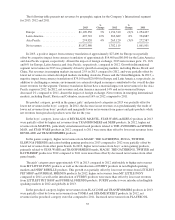
The following table presents net revenues and operating profit data for the Company’s three principal
segments for 2013, 2012 and 2011.
2013
%
Change 2012
%
Change 2011
Net Revenues
U.S. and Canada ............... $2,006,079 (5)% $2,116,297 (6)% $2,253,458
International .................. $1,872,980 5% $1,782,119 (4)% $1,861,901
Entertainment and Licensing ..... $ 190,955 5% $ 181,430 12% $ 162,233
Operating Profit
U.S. and Canada ............... $ 313,746 (2)% $ 319,072 15% $ 278,356
International .................. $ 235,482 9% $ 215,489 (20)% $ 270,578
Entertainment and Licensing ..... $ 45,476 (15)% $ 53,191 24% $ 42,784
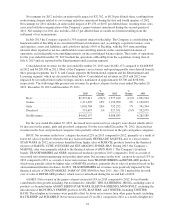
U.S. and Canada
U.S. and Canada segment net revenues for the year ended December 29, 2013 decreased 5% compared to
2012 and 6% in 2012 compared to 2011. The impact of currency translation was not material in 2013 and 2012.
Lower net revenues in 2013 were partially due to continued challenging economic conditions which resulted in
lower consumer spending; however, the U.S. and Canada Segment did achieve growth in franchise brands in
2013. In 2013 and 2012, lower net revenues from boys and preschool products were only partially offset by
higher net revenues from girls and games products.
33