Hasbro 2013 Annual Report Download - page 46
Download and view the complete annual report
Please find page 46 of the 2013 Hasbro annual report below. You can navigate through the pages in the report by either clicking on the pages listed below, or by using the keyword search tool below to find specific information within the annual report.-
 1
1 -
2
-
3
-
4
-
5
-
6
-
7
-
8
-
9
-
10
-
11
-
12
-
13
-
14
-
15
-
16
-
17
-
18
-
19
-
20
-
21
-
22
-
23
-
24
-
25
-
26
-
27
-
28
-
29
-
30
-
31
-
32
-
33
-
34
-
35
-
 36
36 -
 37
37 -
 38
38 -
 39
39 -
 40
40 -
 41
41 -
 42
42 -
 43
43 -
 44
44 -
 45
45 -
 46
46 -
 47
47 -
 48
48 -
 49
49 -
 50
50 -
 51
51 -
 52
52 -
 53
53 -
 54
54 -
 55
55 -
 56
56 -
57
-
58
-
59
-
60
-
61
-
62
-
63
-
64
-
65
-
66
-
67
-
68
-
69
-
70
-
71
-
72
-
73
-
74
-
75
-
76
-
77
-
78
-
79
-
80
-
81
-
82
-
83
-
84
-
85
-
86
-
87
-
88
-
89
-
90
-
91
-
92
-
93
-
94
-
95
-
96
-
97
-
98
-
99
-
100
-
101
-
102
-
103
-
104
-
105
-
106
-
107
-
108
-
109
-
110
-
111
-
112
-
113
-
114
-
115
-
116
-
117
-
118
-
119
-
120
 |
 |
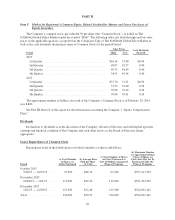
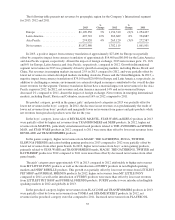
In the boys’ category, lower sales of MARVEL, BEYBLADE and STAR WARS products in 2013
compared to 2012 more than offset slightly higher net revenues from NERF and TRANSFORMERS products. In
2012, higher sales of MARVEL products, particularly entertainment-based products related to THE AVENGERS
and SPIDER-MAN, compared to 2011 were more than offset by lower net revenues from TRANSFORMERS,
STAR WARS, BEYBLADE and NERF products. 2011 TRANSFORMERS revenues were positively impacted
by the movie release.
In the games category, higher net revenues from MAGIC: THE GATHERING, MONOPOLY, ELEFUN &
FRIENDS, DUEL MASTERS, JENGA, OPERATION and TWISTER products in 2013 compared to 2012 more
than offset lower net revenues from other traditional board games. In 2012, higher net revenues from MAGIC:
THE GATHERING, TWISTER, BATTLESHIP and boys’ action gaming products, primarily STAR WARS and
TRANSFORMERS products, were partially offset by lower net revenues from other game brands.
In the girls’ category, higher net revenues from MY LITTLE PONY products along with the introduction of
NERF REBELLE products contributed to the category’s growth in 2013. This growth was only partially offset by
lower net revenues from LITTLEST PET SHOP, ONE DIRECTION, BABY ALIVE and FURBY products. In
2012, higher net revenues from MY LITTLE PONY and EASY BAKE products as well as the introduction of
FURBY and ONE DIRECTION products contributed to growth in the girls’ category. These increases were
partially offset by lower net revenues from FURREAL FRIENDS, STRAWBERRY SHORTCAKE, LITTLEST
PET SHOP and BABY ALIVE products in 2012.
In the preschool category, higher net revenues from SESAME STREET, PLAY-DOH and PLAYSKOOL
HEROES products, primarily related to the TRANSFORMERS brand, were more than offset by lower net
revenues from PLAYSKOOL and TONKA products. In 2012, increased net revenues from PLAYSKOOL
HEROES, primarily related to MARVEL characters, and to a lesser extent higher net revenues from PLAY-DOH
products, were more than offset by decreased sales of SESAME STREET and TONKA products.
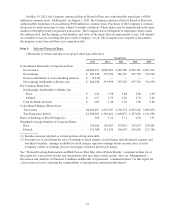
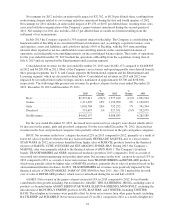
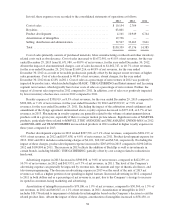
U.S. and Canada operating profit decreased 2% in 2013 compared to 2012 and increased 15% in 2012
compared to 2011. Operating profit margin improved to 15.6% in 2013 compared to 15.1% in 2012. Operating
profit for the year ended December 30, 2012 includes restructuring charges of $2,444. Absent these charges,
operating profit margin was 15.2% in 2012. Operating profit decreased in dollars as a result of the impact of
lower net revenues and, to a lesser extent, higher product development and selling, distribution and
administration expenses partially offset by lower advertising expense. Operating profit margin increased as a
result of improved product mix and lower advertising expense as a percentage of net revenues partially offset by
higher product development and selling, distribution and administration expenses as a percentage of net
revenues. Operating profit margin improved to 15.1% in 2012 compared to 12.4% in 2011. The increase in
operating profit and margin was primarily the result of product mix as well as improved inventory management,
which resulted in lower inventory obsolescence costs in 2012 compared to 2011. Changes in product mix
included a reduced impact from closeout sales in 2012 compared to 2011. Foreign currency translation did not
have a material impact on U.S. and Canada operating profit in 2013 or 2012.
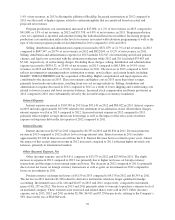
International
International segment net revenues for the year ended December 29, 2013 increased 5% compared to 2012
while net revenues for the year ended December 30, 2012 decreased 4% compared to 2011. In 2013 and 2012,
net revenues were impacted by favorable/(unfavorable) currency translation of approximately $7,000 and
$(98,000), respectively, as a result of fluctuations in the U.S. dollar. Excluding the impact of foreign exchange,
net revenues for 2013 and 2012 increased 5% and 1%, respectively, compared to prior years.
34