Hasbro 2013 Annual Report Download - page 48
Download and view the complete annual report
Please find page 48 of the 2013 Hasbro annual report below. You can navigate through the pages in the report by either clicking on the pages listed below, or by using the keyword search tool below to find specific information within the annual report.-
 1
1 -
2
-
3
-
4
-
5
-
6
-
7
-
8
-
9
-
10
-
11
-
12
-
13
-
14
-
15
-
16
-
17
-
18
-
19
-
20
-
21
-
22
-
23
-
24
-
25
-
26
-
27
-
28
-
29
-
30
-
31
-
32
-
33
-
34
-
35
-
36
-
37
-
 38
38 -
 39
39 -
 40
40 -
 41
41 -
 42
42 -
 43
43 -
 44
44 -
 45
45 -
 46
46 -
 47
47 -
 48
48 -
 49
49 -
 50
50 -
 51
51 -
 52
52 -
 53
53 -
 54
54 -
 55
55 -
 56
56 -
 57
57 -
 58
58 -
59
-
60
-
61
-
62
-
63
-
64
-
65
-
66
-
67
-
68
-
69
-
70
-
71
-
72
-
73
-
74
-
75
-
76
-
77
-
78
-
79
-
80
-
81
-
82
-
83
-
84
-
85
-
86
-
87
-
88
-
89
-
90
-
91
-
92
-
93
-
94
-
95
-
96
-
97
-
98
-
99
-
100
-
101
-
102
-
103
-
104
-
105
-
106
-
107
-
108
-
109
-
110
-
111
-
112
-
113
-
114
-
115
-
116
-
117
-
118
-
119
-
120
 |
 |
HEROES products, primarily MARVEL-related, and PLAY-DOH products were wholly offset by decreased net
revenues from PLAYSKOOL and SESAME STREET products.
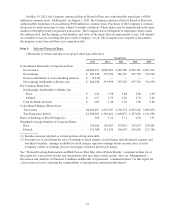
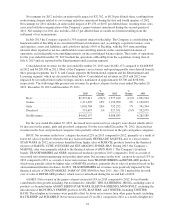
International segment operating profit increased 9% in 2013 compared to 2012 and decreased 20% in 2012
compared to 2011. Operating profit margin increased to 12.6% of net revenues in 2013 from 12.1% of net
revenues in 2012 and decreased in 2012 from 14.5% of net revenues in 2011. Operating profit for the
International segment in 2013 and 2012 was impacted by approximately $4,700 and $(11,900), respectively, due
to the favorable/(unfavorable) impact from translation of foreign currencies to the U.S. dollar. Operating profit
for the year ended December 30, 2012 includes restructuring charges of $1,628. Excluding the impact of
restructuring charges, the operating profit margin in 2012 was 12.2%. In 2013, operating profit and margins
improved primarily due to higher net revenues discussed above. While most operating expenses increased in
dollars, they decreased as a percent of net revenues. In 2012, decreases in operating profit and operating profit
margin were primarily due to lower net revenues discussed above in addition to higher selling, distribution and
administration expenses. Higher cost of sales as a percentage of net revenues was partially offset by lower
royalty expense as a result of the mix of entertainment-based and non-entertainment based product sales. Further,
the decline in operating profit margin in 2012 compared to 2011 reflects the change in geographical mix of net
revenues, with a higher percentage coming from emerging markets, which currently have lower operating profit
margins than the Company has in developed markets.
Entertainment and Licensing
Entertainment and Licensing segment net revenues increased 5% in 2013 compared to 2012 and 12% in
2012 compared to 2011. Increased net revenues in 2013 compared to 2012 is predominately the result of
investment to grow the Company’s global licensing organization, particularly lifestyle licensing, and expand into
emerging markets as well as diversification in strategic digital gaming partnerships including the acquisition of a
majority stake in Backflip. These higher net revenues were partially offset by lower net revenues from
distribution of television programming, specifically digital distribution, as 2012 net revenues include the initial
distribution of Hasbro Studios television programming libraries to Netflix. Higher net revenues in 2012
compared to 2011 were primarily due to the sale and distribution of television programming which included
global television distribution, digital distribution and home entertainment, partially offset by decreased net
revenues from lifestyle licensing primarily relating to lower TRANSFORMERS movie-related licensing
revenues.
Entertainment and Licensing segment operating profit decreased 15% in 2013 compared to 2012 and
increased 24% in 2012 compared to 2011. Operating profit for 2013 and 2012 includes restructuring charges of
$1,729 and $555, respectively. Excluding restructuring charges, increased operating profit from lifestyle and
digital gaming licensing was offset by operating losses from entertainment and the addition of Backflip.
Operating profit for 2013 includes an approximate $7,600 operating loss for Backflip, primarily due to
amortization of acquired intangibles. In 2012, higher net revenues from television programming distribution
directly contributed to an increased operating profit.
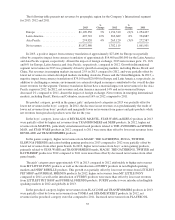
Other Segments and Corporate and Eliminations
In the Global Operations segment, an operating profit of $6,712 in 2013 compared to operating losses of
$15,964 and $7,948 in 2012 and 2011, respectively. The operating loss in 2012 included severance costs of
$4,307 associated with restructuring activities. The improvement in operating results in the Global Operations
segment is primarily due to improvements made in owned manufacturing facilities and expense reductions
associated with restructuring activities.
In Corporate and Eliminations, operating losses of $134,323 and $20,003 in 2013 and 2012, respectively,
compared to operating profit of $10,211 in 2011. Corporate and Eliminations includes restructuring and related
pension charges of $41,973 for the year ended December 29, 2013 and restructuring charges of $38,242 and
$14,385 for the years ended December 30, 2012 and December 25, 2011, respectively. The Corporate and
36