Hasbro 2013 Annual Report Download - page 75
Download and view the complete annual report
Please find page 75 of the 2013 Hasbro annual report below. You can navigate through the pages in the report by either clicking on the pages listed below, or by using the keyword search tool below to find specific information within the annual report.-
 1
1 -
2
-
3
-
4
-
5
-
6
-
7
-
8
-
9
-
10
-
11
-
12
-
13
-
14
-
15
-
16
-
17
-
18
-
19
-
20
-
21
-
22
-
23
-
24
-
25
-
26
-
27
-
28
-
29
-
30
-
31
-
32
-
33
-
34
-
35
-
36
-
37
-
38
-
39
-
40
-
41
-
42
-
43
-
44
-
45
-
46
-
47
-
48
-
49
-
50
-
51
-
52
-
53
-
54
-
55
-
56
-
57
-
58
-
59
-
60
-
61
-
62
-
63
-
64
-
 65
65 -
 66
66 -
 67
67 -
 68
68 -
 69
69 -
 70
70 -
 71
71 -
 72
72 -
 73
73 -
 74
74 -
 75
75 -
 76
76 -
 77
77 -
 78
78 -
 79
79 -
 80
80 -
 81
81 -
 82
82 -
 83
83 -
 84
84 -
 85
85 -
86
-
87
-
88
-
89
-
90
-
91
-
92
-
93
-
94
-
95
-
96
-
97
-
98
-
99
-
100
-
101
-
102
-
103
-
104
-
105
-
106
-
107
-
108
-
109
-
110
-
111
-
112
-
113
-
114
-
115
-
116
-
117
-
118
-
119
-
120
 |
 |
HASBRO, INC. AND SUBSIDIARIES
Notes to Consolidated Financial Statements — (Continued)
(Thousands of Dollars and Shares Except Per Share Data)
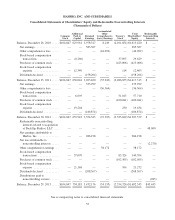
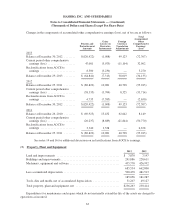
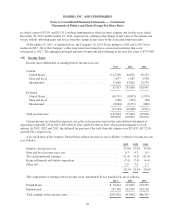
Changes in the components of accumulated other comprehensive earnings (loss), net of tax are as follows:
Pension and
Postretirement
Amounts
Gains
(Losses) on
Derivative
Instruments
Foreign
Currency
Translation
Adjustments
Total
Accumulated
Other
Comprehensive
Earnings
(Loss)
2013
Balance at December 30, 2012 ........ $(120,422) (1,008) 49,123 (72,307)
Current period other comprehensive
earnings (loss) ................... 47,081 (3,075) (11,104) 32,902
Reclassifications from AOCE to
earnings ........................ 8,500 (3,230) — 5,270
Balance at December 29, 2013 ........ $ (64,841) (7,313) 38,019 (34,135)
2012
Balance at December 25, 2011 ........ $ (86,822) 10,081 40,798 (35,943)
Current period other comprehensive
earnings (loss) ................... (38,335) (3,704) 8,325 (33,714)
Reclassifications from AOCE to
earnings ........................ 4,735 (7,385) — (2,650)
Balance at December 30, 2012 ........ $(120,422) (1,008) 49,123 (72,307)
2011
Balance at December 26, 2010 ........ $ (69,925) 15,432 62,642 8,149
Current period other comprehensive
earnings (loss) ................... (20,237) (8,689) (21,844) (50,770)
Reclassifications from AOCE to
earnings ........................ 3,340 3,338 — 6,678
Balance at December 25, 2011 ........ $ (86,822) 10,081 40,798 (35,943)
See notes 14 and 16 for additional discussion on reclassifications from AOCE to earnings.
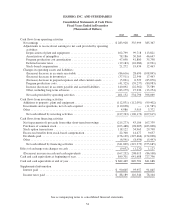
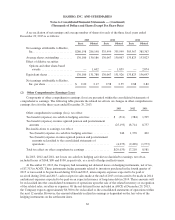
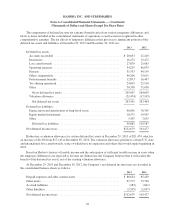
(3) Property, Plant and Equipment
2013 2012
Land and improvements ........................................... $ 7,870 7,197
Buildings and improvements ........................................ 241,886 228,611
Machinery, equipment and software .................................. 435,778 426,992
685,534 662,800
Less accumulated depreciation ...................................... 500,478 481,513
185,056 181,287
Tools, dies and molds, net of accumulated depreciation .................. 51,207 49,127
Total property, plant and equipment, net .............................. $236,263 230,414
Expenditures for maintenance and repairs which do not materially extend the life of the assets are charged to
operations as incurred.
63