GameStop 2004 Annual Report Download - page 81
Download and view the complete annual report
Please find page 81 of the 2004 GameStop annual report below. You can navigate through the pages in the report by either clicking on the pages listed below, or by using the keyword search tool below to find specific information within the annual report.-
 1
1 -
2
-
3
-
4
-
5
-
6
-
7
-
8
-
9
-
10
-
11
-
12
-
13
-
14
-
15
-
16
-
17
-
18
-
19
-
20
-
21
-
22
-
23
-
24
-
25
-
26
-
27
-
28
-
29
-
30
-
31
-
32
-
33
-
34
-
35
-
36
-
37
-
38
-
39
-
40
-
41
-
42
-
43
-
44
-
45
-
46
-
47
-
48
-
49
-
50
-
51
-
52
-
53
-
54
-
55
-
56
-
57
-
58
-
59
-
60
-
61
-
62
-
63
-
64
-
65
-
66
-
67
-
68
-
69
-
70
-
 71
71 -
 72
72 -
 73
73 -
 74
74 -
 75
75 -
 76
76 -
 77
77 -
 78
78 -
 79
79 -
 80
80 -
 81
81 -
 82
82 -
 83
83 -
 84
84 -
 85
85 -
 86
86 -
 87
87 -
 88
88 -
 89
89 -
 90
90 -
 91
91 -
92
 |
 |

GAMESTOP CORP.
NOTES TO CONSOLIDATED FINANCIAL STATEMENTS Ì (Continued)
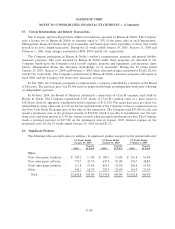
The following table sets forth gross proÑt (in millions) and gross proÑt percentages by signiÑcant product
category for the periods indicated:
52 Weeks Ended 52 Weeks Ended 52 Weeks Ended
January 29, 2005 January 31, 2004 February 1, 2003
Gross Gross Gross
Gross ProÑt Gross ProÑt Gross ProÑt
ProÑt Percent ProÑt Percent ProÑt Percent
Gross ProÑt:
New video game hardware ÏÏÏÏÏÏÏÏÏÏÏ $ 8.5 4.1% $ 10.6 5.3% $ 4.4 2.0%
New video game software ÏÏÏÏÏÏÏÏÏÏÏÏ 151.9 19.6% 128.6 19.9% 93.7 17.9%
Used video game products ÏÏÏÏÏÏÏÏÏÏÏ 231.6 45.3% 179.3 44.5% 142.8 48.2%
Other ÏÏÏÏÏÏÏÏÏÏÏÏÏÏÏÏÏÏÏÏÏÏÏÏÏÏÏÏÏ 117.3 34.0% 114.4 34.7% 99.7 31.7%
Total ÏÏÏÏÏÏÏÏÏÏÏÏÏÏÏÏÏÏÏÏÏÏÏÏÏÏÏ $509.3 27.6% $432.9 27.4% $340.6 25.2%
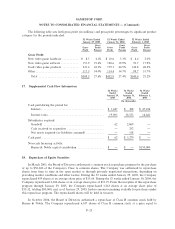
17. Supplemental Cash Flow Information
52 Weeks 52 Weeks 52 Weeks
Ended Ended Ended
January 29, January 31, February 1,
2005 2004 2003
(In thousands)
Cash paid during the period for:
InterestÏÏÏÏÏÏÏÏÏÏÏÏÏÏÏÏÏÏÏÏÏÏÏÏÏÏÏÏÏÏÏÏÏÏÏÏÏÏÏÏÏÏÏ $ 1,447 $ 308 $ 47,236
Income taxes ÏÏÏÏÏÏÏÏÏÏÏÏÏÏÏÏÏÏÏÏÏÏÏÏÏÏÏÏÏÏÏÏÏÏÏÏÏÏ 19,903 56,555 14,641
Subsidiaries acquired:
Goodwill ÏÏÏÏÏÏÏÏÏÏÏÏÏÏÏÏÏÏÏÏÏÏÏÏÏÏÏÏÏÏÏÏÏÏÏÏÏÏÏÏÏ 62 2,869 Ì
Cash received in acquisition ÏÏÏÏÏÏÏÏÏÏÏÏÏÏÏÏÏÏÏÏÏÏÏÏÏ Ì 252 Ì
Net assets acquired (or liabilities assumed) ÏÏÏÏÏÏÏÏÏÏÏÏ Ì 158 Ì
Cash paidÏÏÏÏÏÏÏÏÏÏÏÏÏÏÏÏÏÏÏÏÏÏÏÏÏÏÏÏÏÏÏÏÏÏÏÏÏÏÏÏÏÏÏ $ 62 $ 3,279 $ Ì
Non-cash Ñnancing activity:
Barnes & Noble capital contribution ÏÏÏÏÏÏÏÏÏÏÏÏÏÏÏÏÏÏ $ Ì $ Ì $150,000
18. Repurchase of Equity Securities
In March 2003, the Board of Directors authorized a common stock repurchase program for the purchase
of up to $50,000 of the Company's Class A common shares. The Company was authorized to repurchase
shares from time to time in the open market or through privately negotiated transactions, depending on
prevailing market conditions and other factors. During the 52 weeks ended January 29, 2005, the Company
repurchased 959 shares at an average share price of $15.64. During the 52 weeks ended January 30, 2004, the
Company repurchased 2,304 shares at an average share price of $15.19. From the inception of this repurchase
program through January 29, 2005, the Company repurchased 3,263 shares at an average share price of
$15.32, totaling $50,000, and, as of January 29, 2005, had no amount remaining available for purchases under
this repurchase program. The repurchased shares will be held in treasury.
In October 2004, the Board of Directors authorized a repurchase of Class B common stock held by
Barnes & Noble. The Company repurchased 6,107 shares of Class B common stock at a price equal to
F-25