GameStop 2004 Annual Report Download - page 64
Download and view the complete annual report
Please find page 64 of the 2004 GameStop annual report below. You can navigate through the pages in the report by either clicking on the pages listed below, or by using the keyword search tool below to find specific information within the annual report.-
 1
1 -
2
-
3
-
4
-
5
-
6
-
7
-
8
-
9
-
10
-
11
-
12
-
13
-
14
-
15
-
16
-
17
-
18
-
19
-
20
-
21
-
22
-
23
-
24
-
25
-
26
-
27
-
28
-
29
-
30
-
31
-
32
-
33
-
34
-
35
-
36
-
37
-
38
-
39
-
40
-
41
-
42
-
43
-
44
-
45
-
46
-
47
-
48
-
49
-
50
-
51
-
52
-
53
-
 54
54 -
 55
55 -
 56
56 -
 57
57 -
 58
58 -
 59
59 -
 60
60 -
 61
61 -
 62
62 -
 63
63 -
 64
64 -
 65
65 -
 66
66 -
 67
67 -
 68
68 -
 69
69 -
 70
70 -
 71
71 -
 72
72 -
 73
73 -
 74
74 -
75
-
76
-
77
-
78
-
79
-
80
-
81
-
82
-
83
-
84
-
85
-
86
-
87
-
88
-
89
-
90
-
91
-
92
 |
 |

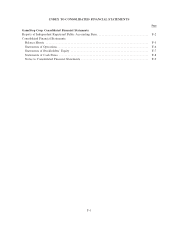
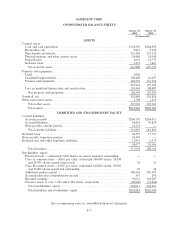
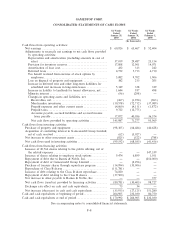
GAMESTOP CORP.
CONSOLIDATED STATEMENTS OF CASH FLOWS
52 Weeks 52 Weeks 52 Weeks
Ended Ended Ended
January 29, January 31, February 1,
2005 2004 2003
(In thousands)
Cash Öows from operating activities:
Net earnings ÏÏÏÏÏÏÏÏÏÏÏÏÏÏÏÏÏÏÏÏÏÏÏÏÏÏÏÏÏÏÏÏÏÏÏÏÏÏÏÏÏÏÏÏ $ 60,926 $ 63,467 $ 52,404
Adjustments to reconcile net earnings to net cash Öows provided
by operating activities:
Depreciation and amortization (including amounts in cost of
sales) ÏÏÏÏÏÏÏÏÏÏÏÏÏÏÏÏÏÏÏÏÏÏÏÏÏÏÏÏÏÏÏÏÏÏÏÏÏÏÏÏÏÏÏÏÏÏ 37,019 29,487 23,154
Provision for inventory reserves ÏÏÏÏÏÏÏÏÏÏÏÏÏÏÏÏÏÏÏÏÏÏÏÏÏÏÏ 17,808 12,901 14,071
Amortization of loan costÏÏÏÏÏÏÏÏÏÏÏÏÏÏÏÏÏÏÏÏÏÏÏÏÏÏÏÏÏÏÏÏ 432 313 242
Deferred taxes ÏÏÏÏÏÏÏÏÏÏÏÏÏÏÏÏÏÏÏÏÏÏÏÏÏÏÏÏÏÏÏÏÏÏÏÏÏÏÏÏÏ 4,752 5,713 4,710
Tax beneÑt realized from exercise of stock options by
employeesÏÏÏÏÏÏÏÏÏÏÏÏÏÏÏÏÏÏÏÏÏÏÏÏÏÏÏÏÏÏÏÏÏÏÏÏÏÏÏÏÏÏÏ 5,082 9,702 1,906
Loss on disposal of property and equipment ÏÏÏÏÏÏÏÏÏÏÏÏÏÏÏÏ 382 213 205
Increase in deferred rent and other long-term liabilities for
scheduled rent increases in long-term leases ÏÏÏÏÏÏÏÏÏÏÏÏÏÏ 5,349 338 329
Increase in liability to landlords for tenant allowances, net ÏÏÏÏ 1,644 937 498
Minority interest ÏÏÏÏÏÏÏÏÏÏÏÏÏÏÏÏÏÏÏÏÏÏÏÏÏÏÏÏÏÏÏÏÏÏÏÏÏÏÏ (96) (298) Ì
Changes in operating assets and liabilities, net
Receivables, netÏÏÏÏÏÏÏÏÏÏÏÏÏÏÏÏÏÏÏÏÏÏÏÏÏÏÏÏÏÏÏÏÏÏÏÏÏÏ (267) (1,954) (963)
Merchandise inventoriesÏÏÏÏÏÏÏÏÏÏÏÏÏÏÏÏÏÏÏÏÏÏÏÏÏÏÏÏÏÏÏ (10,578) (72,712) (37,089)
Prepaid expenses and other current assets ÏÏÏÏÏÏÏÏÏÏÏÏÏÏÏÏ (4,060) (4,111) (1,872)
Prepaid taxes ÏÏÏÏÏÏÏÏÏÏÏÏÏÏÏÏÏÏÏÏÏÏÏÏÏÏÏÏÏÏÏÏÏÏÏÏÏÏÏÏ 9,722 (12,775) Ì
Accounts payable, accrued liabilities and accrued income
taxes payable ÏÏÏÏÏÏÏÏÏÏÏÏÏÏÏÏÏÏÏÏÏÏÏÏÏÏÏÏÏÏÏÏÏÏÏÏÏÏ 17,872 40,056 36,374
Net cash Öows provided by operating activitiesÏÏÏÏÏÏÏÏÏÏÏÏ 145,987 71,277 93,969
Cash Öows from investing activities:
Purchase of property and equipment ÏÏÏÏÏÏÏÏÏÏÏÏÏÏÏÏÏÏÏÏÏÏÏÏ (98,305) (64,484) (40,628)
Acquisition of controlling interest in Gamesworld Group Limited,
net of cash received ÏÏÏÏÏÏÏÏÏÏÏÏÏÏÏÏÏÏÏÏÏÏÏÏÏÏÏÏÏÏÏÏÏÏÏÏ (62) (3,027) Ì
Net increase in other noncurrent assets ÏÏÏÏÏÏÏÏÏÏÏÏÏÏÏÏÏÏÏÏÏÏ (825) (522) (788)
Net cash Öows used in investing activities ÏÏÏÏÏÏÏÏÏÏÏÏÏÏÏÏÏÏÏÏ (99,192) (68,033) (41,416)
Cash Öows from Ñnancing activities:
Issuance of 20,764 shares relating to the public oÅering, net of
the related expenses ÏÏÏÏÏÏÏÏÏÏÏÏÏÏÏÏÏÏÏÏÏÏÏÏÏÏÏÏÏÏÏÏÏÏÏÏ Ì Ì 347,339
Issuance of shares relating to employee stock options ÏÏÏÏÏÏÏÏÏÏ 9,474 6,899 1,011
Repayment of debt due to Barnes & Noble, Inc. ÏÏÏÏÏÏÏÏÏÏÏÏÏ Ì Ì (250,000)
Repayment of debt of Gamesworld Group Limited ÏÏÏÏÏÏÏÏÏÏÏÏ Ì (2,296) Ì
Purchase of treasury shares through repurchase program ÏÏÏÏÏÏÏ (14,994) (35,006) Ì
Repurchase of Class B shares ÏÏÏÏÏÏÏÏÏÏÏÏÏÏÏÏÏÏÏÏÏÏÏÏÏÏÏÏÏÏ (111,781) Ì Ì
Issuance of debt relating to the Class B share repurchaseÏÏÏÏÏÏÏ 74,020 Ì Ì
Repayment of debt relating to the Class B shares ÏÏÏÏÏÏÏÏÏÏÏÏÏ (37,500) Ì Ì
Net increase in other payable to Barnes & Noble, Inc. ÏÏÏÏÏÏÏÏ Ì Ì 377
Net cash Öows (used in) provided by Ñnancing activities ÏÏÏÏÏÏÏ (80,781) (30,403) 98,727
Exchange rate eÅect on cash and cash equivalentsÏÏÏÏÏÏÏÏÏÏÏÏÏ 73 34 Ì
Net increase (decrease) in cash and cash equivalents ÏÏÏÏÏÏÏÏÏÏ (33,913) (27,125) 151,280
Cash and cash equivalents at beginning of periodÏÏÏÏÏÏÏÏÏÏÏÏÏÏÏÏ 204,905 232,030 80,750
Cash and cash equivalents at end of periodÏÏÏÏÏÏÏÏÏÏÏÏÏÏÏÏÏÏÏÏÏ $ 170,992 $ 204,905 $ 232,030
See accompanying notes to consolidated Ñnancial statements.
F-8