GameStop 2004 Annual Report Download - page 46
Download and view the complete annual report
Please find page 46 of the 2004 GameStop annual report below. You can navigate through the pages in the report by either clicking on the pages listed below, or by using the keyword search tool below to find specific information within the annual report.-
 1
1 -
2
-
3
-
4
-
5
-
6
-
7
-
8
-
9
-
10
-
11
-
12
-
13
-
14
-
15
-
16
-
17
-
18
-
19
-
20
-
21
-
22
-
23
-
24
-
25
-
26
-
27
-
28
-
29
-
30
-
31
-
32
-
33
-
34
-
35
-
 36
36 -
 37
37 -
 38
38 -
 39
39 -
 40
40 -
 41
41 -
 42
42 -
 43
43 -
 44
44 -
 45
45 -
 46
46 -
 47
47 -
 48
48 -
 49
49 -
 50
50 -
 51
51 -
 52
52 -
 53
53 -
 54
54 -
 55
55 -
 56
56 -
57
-
58
-
59
-
60
-
61
-
62
-
63
-
64
-
65
-
66
-
67
-
68
-
69
-
70
-
71
-
72
-
73
-
74
-
75
-
76
-
77
-
78
-
79
-
80
-
81
-
82
-
83
-
84
-
85
-
86
-
87
-
88
-
89
-
90
-
91
-
92
 |
 |

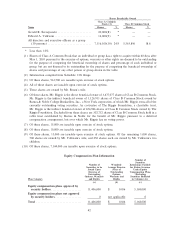
Grants of Stock Options in Last Fiscal Year
The following table shows all grants of options to acquire shares of our Class A Common Stock granted to
the executive oÇcers named in the summary compensation table in the ""Executive Compensation'' section of
this Proxy Statement for the year ended January 29, 2005. The options for executive oÇcers to acquire shares
of our Class A Common Stock were granted on March 11, 2005, based on performance for the year ended
January 29, 2005. The potential realizable value is calculated based on the term of the option at its date of
grant. It is calculated assuming that the fair market value of our Class A Common Stock on the date of grant
appreciates at the indicated annual rates compounded annually for the entire term of the option and that the
option is exercised and sold on the last day of its term for the appreciated stock. These numbers are calculated
based on the requirements of the SEC and do not reÖect our estimate of future stock price growth.
Option/SAR Grants In Last Fiscal Year
Individual Grants
% of Potential Realizable Value at
Number of Total Assumed Annual Rates of
Securities Options Exercise Market Stock Price Appreciation for
Underlying Granted or Base Price on Option Term
Options in Fiscal Price Date of Expiration
Granted Year ($/Shs.) Grant Date 5%($) 10%($)
R. Richard Fontaine
GameStop Class A Common
StockÏÏÏÏÏÏÏÏÏÏÏÏÏÏÏÏÏÏÏÏÏÏÏÏÏ 150,000 7.1% $20.25 $20.25 3/10/15 $1,910,000 $4,841,000
Daniel A. DeMatteo
GameStop Class A Common
StockÏÏÏÏÏÏÏÏÏÏÏÏÏÏÏÏÏÏÏÏÏÏÏÏÏ 150,000 7.1% $20.25 $20.25 3/10/15 $1,910,000 $4,841,000
David W. Carlson
GameStop Class A Common
StockÏÏÏÏÏÏÏÏÏÏÏÏÏÏÏÏÏÏÏÏÏÏÏÏÏ 75,000 3.6% $20.25 $20.25 3/10/15 $ 955,000 $2,420,000
Ronald Freeman
GameStop Class A Common
StockÏÏÏÏÏÏÏÏÏÏÏÏÏÏÏÏÏÏÏÏÏÏÏÏÏ 66,000 3.1% $20.25 $20.25 3/10/15 $ 841,000 $2,130,000
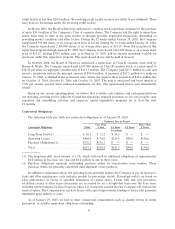
Fiscal Year End Option Value
The following table provides information for the executive oÇcers named in the summary compensation
table in the ""Executive Compensation'' section of this Proxy Statement regarding exercises of options to
purchase shares of our Class A Common Stock during the year ended January 29, 2005 and our options held
as of January 29, 2005 by any of our named executive oÇcers. The values realized upon exercise in the table
have been calculated using the stock price at the times of exercise. The year-end values in the table for our
Class A Common Stock have been calculated based on the $18.80 per share closing price of our Class A
39