GameStop 2004 Annual Report Download - page 28
Download and view the complete annual report
Please find page 28 of the 2004 GameStop annual report below. You can navigate through the pages in the report by either clicking on the pages listed below, or by using the keyword search tool below to find specific information within the annual report.-
 1
1 -
2
-
3
-
4
-
5
-
6
-
7
-
8
-
9
-
10
-
11
-
12
-
13
-
14
-
15
-
16
-
17
-
 18
18 -
 19
19 -
 20
20 -
 21
21 -
 22
22 -
 23
23 -
 24
24 -
 25
25 -
 26
26 -
 27
27 -
 28
28 -
 29
29 -
 30
30 -
 31
31 -
 32
32 -
 33
33 -
 34
34 -
 35
35 -
 36
36 -
 37
37 -
 38
38 -
39
-
40
-
41
-
42
-
43
-
44
-
45
-
46
-
47
-
48
-
49
-
50
-
51
-
52
-
53
-
54
-
55
-
56
-
57
-
58
-
59
-
60
-
61
-
62
-
63
-
64
-
65
-
66
-
67
-
68
-
69
-
70
-
71
-
72
-
73
-
74
-
75
-
76
-
77
-
78
-
79
-
80
-
81
-
82
-
83
-
84
-
85
-
86
-
87
-
88
-
89
-
90
-
91
-
92
 |
 |

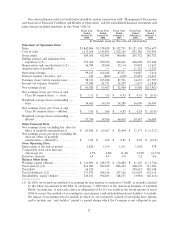
Our selected Ñnancial data set forth below should be read in conjunction with ""Management's Discussion
and Analysis of Financial Condition and Results of Operations'' and the consolidated Ñnancial statements and
notes thereto included elsewhere in this Form 10-K/A.
Fiscal Year Fiscal Year Fiscal Year Fiscal Year Fiscal Year
Ended Ended Ended Ended Ended
January 29, January 31, February 1, February 2, February 3,
2005 2004 2003 2002 2001
In Thousands, except per share data and statistical data
Statement of Operations Data:
Sales ÏÏÏÏÏÏÏÏÏÏÏÏÏÏÏÏÏÏÏÏÏÏÏÏÏÏÏÏÏÏÏÏ $1,842,806 $1,578,838 $1,352,791 $1,121,138 $756,697
Cost of sales ÏÏÏÏÏÏÏÏÏÏÏÏÏÏÏÏÏÏÏÏÏÏÏÏÏÏ 1,333,506 1,145,893 1,012,145 855,386 570,995
Gross proÑt ÏÏÏÏÏÏÏÏÏÏÏÏÏÏÏÏÏÏÏÏÏÏÏÏÏÏÏ 509,300 432,945 340,646 265,752 185,702
Selling, general and administrative
expenses(1)(2)ÏÏÏÏÏÏÏÏÏÏÏÏÏÏÏÏÏÏÏÏÏÏ 373,364 299,193 230,461 200,698 157,242
Depreciation and amortization(1)(2) ÏÏÏÏÏ 36,789 29,368 23,114 19,842 13,623
Amortization of goodwill ÏÏÏÏÏÏÏÏÏÏÏÏÏÏÏÏ Ì Ì Ì 11,125 9,223
Operating earnings ÏÏÏÏÏÏÏÏÏÏÏÏÏÏÏÏÏÏÏÏÏ 99,147 104,384 87,071 34,087 5,614
Interest expense (income), netÏÏÏÏÏÏÏÏÏÏÏ 236 (804) (630) 19,452 23,411
Earnings (loss) before income taxes ÏÏÏÏÏÏ 98,911 105,188 87,701 14,635 (17,797)
Income tax expense (beneÑt)ÏÏÏÏÏÏÏÏÏÏÏÏ 37,985 41,721 35,297 7,675 (5,836)
Net earnings (loss) ÏÏÏÏÏÏÏÏÏÏÏÏÏÏÏÏÏÏÏÏ $ 60,926 $ 63,467 $ 52,404 $ 6,960 $(11,961)
Net earnings (loss) per Class A and
Class B common share Ì basic ÏÏÏÏÏÏÏ $ 1.11 $ 1.13 $ 0.93 $ 0.19 $ (0.33)
Weighted average shares outstanding Ì
basicÏÏÏÏÏÏÏÏÏÏÏÏÏÏÏÏÏÏÏÏÏÏÏÏÏÏÏÏÏÏÏ 54,662 56,330 56,289 36,009 36,009
Net earnings (loss) per Class A and
Class B common share Ì dilutedÏÏÏÏÏÏÏ $ 1.05 $ 1.06 $ 0.87 $ 0.18 $ (0.33)
Weighted average shares outstanding Ì
diluted ÏÏÏÏÏÏÏÏÏÏÏÏÏÏÏÏÏÏÏÏÏÏÏÏÏÏÏÏÏ 57,796 59,764 60,419 39,397 36,009
Other Financial Data:
Net earnings (loss) excluding the after-tax
eÅect of goodwill amortization(3) ÏÏÏÏÏÏ $ 60,926 $ 63,467 $ 52,404 $ 15,373 $ (5,212)
Net earnings (loss) per share excluding the
after-tax eÅect of goodwill
amortization Ì diluted(3)ÏÏÏÏÏÏÏÏÏÏÏÏÏ $ 1.05 $ 1.06 $ 0.87 $ 0.39 $ (0.14)
Store Operating Data:
Stores open at the end of period ÏÏÏÏÏÏÏÏÏ 1,826 1,514 1,231 1,038 978
Comparable store sales increase
(decrease)(4)ÏÏÏÏÏÏÏÏÏÏÏÏÏÏÏÏÏÏÏÏÏÏÏ 1.7% 0.8% 11.4% 32.0% (6.7)%
Inventory turnover ÏÏÏÏÏÏÏÏÏÏÏÏÏÏÏÏÏÏÏÏÏ 5.4 4.9 4.9 5.2 4.6
Balance Sheet Data:
Working capital (deÑcit)ÏÏÏÏÏÏÏÏÏÏÏÏÏÏÏÏ $ 110,093 $ 188,378 $ 174,482 $ 31,107 $ (1,726)
Total assets(1)(2) ÏÏÏÏÏÏÏÏÏÏÏÏÏÏÏÏÏÏÏÏÏ 914,983 902,189 806,237 608,674 511,504
Total debt ÏÏÏÏÏÏÏÏÏÏÏÏÏÏÏÏÏÏÏÏÏÏÏÏÏÏÏÏ 36,520 Ì Ì 399,623 385,148
Total liabilities(1)(2) ÏÏÏÏÏÏÏÏÏÏÏÏÏÏÏÏÏÏ 371,972 308,156 257,562 612,659 532,114
Stockholders' equity (deÑcit) ÏÏÏÏÏÏÏÏÏÏÏÏ 543,011 594,033 548,675 (3,985) (20,610)
(1) In 2004, we revised our method of accounting for rent expense to conform to GAAP, as recently clariÑed
by the Chief Accountant of the SEC in a February 7, 2005 letter to the American Institute of CertiÑed
Public Accountants. A non-cash, after-tax adjustment of $3,312 was made in the fourth quarter of Ñscal
2004 to correct the method of accounting for rent expense (and related deferred rent liability) to include
the impact of escalating rents for periods in which we are reasonably assured of exercising lease options
and to include any ""rent holiday'' period (a period during which the Company is not obligated to pay
21