GameStop 2004 Annual Report Download - page 11
Download and view the complete annual report
Please find page 11 of the 2004 GameStop annual report below. You can navigate through the pages in the report by either clicking on the pages listed below, or by using the keyword search tool below to find specific information within the annual report.-
 1
1 -
 2
2 -
 3
3 -
 4
4 -
 5
5 -
 6
6 -
 7
7 -
 8
8 -
 9
9 -
 10
10 -
 11
11 -
 12
12 -
 13
13 -
 14
14 -
 15
15 -
 16
16 -
 17
17 -
 18
18 -
 19
19 -
 20
20 -
 21
21 -
 22
22 -
23
-
24
-
25
-
26
-
27
-
28
-
29
-
30
-
31
-
32
-
33
-
34
-
35
-
36
-
37
-
38
-
39
-
40
-
41
-
42
-
43
-
44
-
45
-
46
-
47
-
48
-
49
-
50
-
51
-
52
-
53
-
54
-
55
-
56
-
57
-
58
-
59
-
60
-
61
-
62
-
63
-
64
-
65
-
66
-
67
-
68
-
69
-
70
-
71
-
72
-
73
-
74
-
75
-
76
-
77
-
78
-
79
-
80
-
81
-
82
-
83
-
84
-
85
-
86
-
87
-
88
-
89
-
90
-
91
-
92
 |
 |
manufacturers to develop new or enhanced video game platforms, a decline in the continued technological
development and use of multimedia PCs, or the failure of software publishers to develop popular game and
entertainment titles for current or future generation video game systems or PC hardware.
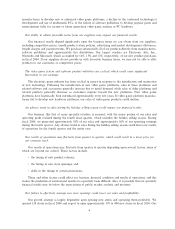
Our ability to obtain favorable terms from our suppliers may impact our Ñnancial results.
Our Ñnancial results depend signiÑcantly upon the business terms we can obtain from our suppliers,
including competitive prices, unsold product return policies, advertising and market development allowances,
freight charges and payment terms. We purchase substantially all of our products directly from manufacturers,
software publishers and approximately Ñve distributors. Our largest vendors are Electronic Arts, Inc.,
Nintendo and Microsoft, which accounted for 14%, 13% and 12%, respectively, of our new product purchases
in Ñscal 2004. If our suppliers do not provide us with favorable business terms, we may not be able to oÅer
products to our customers at competitive prices.
The video game system and software product industries are cyclical, which could cause signiÑcant
Öuctuation in our earnings.
The electronic game industry has been cyclical in nature in response to the introduction and maturation
of new technology. Following the introduction of new video game platforms, sales of these platforms and
related software and accessories generally increase due to initial demand, while sales of older platforms and
related products generally decrease as customers migrate toward the new platforms. New video game
platforms have historically been introduced approximately every Ñve years. If video game platform manufac-
turers fail to develop new hardware platforms, our sales of video game products could decline.
An adverse trend in sales during the holiday selling season could impact our Ñnancial results.
Our business, like that of many specialty retailers, is seasonal, with the major portion of our sales and
operating proÑt realized during the fourth Ñscal quarter, which includes the holiday selling season. During
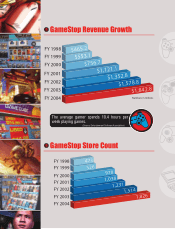
Ñscal 2004, we generated approximately 38% of our sales and approximately 56% of our operating earnings
during the fourth quarter. Any adverse trend in sales during the holiday selling season could lower our results
of operations for the fourth quarter and the entire year.
Our results of operations may Öuctuate from quarter to quarter, which could result in a lower price for
our common stock.
Our results of operations may Öuctuate from quarter to quarter depending upon several factors, some of
which are beyond our control. These factors include:
‚ the timing of new product releases;
‚ the timing of new store openings; and
‚ shifts in the timing of certain promotions.
These and other factors could aÅect our business, Ñnancial condition and results of operations, and this
makes the prediction of our Ñnancial results on a quarterly basis diÇcult. Also, it is possible that our quarterly
Ñnancial results may be below the expectations of public market analysts and investors.
Our failure to eÅectively manage new store openings could lower our sales and proÑtability.
Our growth strategy is largely dependent upon opening new stores and operating them proÑtably. We
opened 338 stores in Ñscal 2004 and expect to open approximately 370 to 400 new stores in Ñscal 2005. Our
4