GameStop 2004 Annual Report Download - page 35
Download and view the complete annual report
Please find page 35 of the 2004 GameStop annual report below. You can navigate through the pages in the report by either clicking on the pages listed below, or by using the keyword search tool below to find specific information within the annual report.-
 1
1 -
2
-
3
-
4
-
5
-
6
-
7
-
8
-
9
-
10
-
11
-
12
-
13
-
14
-
15
-
16
-
17
-
18
-
19
-
20
-
21
-
22
-
23
-
24
-
 25
25 -
 26
26 -
 27
27 -
 28
28 -
 29
29 -
 30
30 -
 31
31 -
 32
32 -
 33
33 -
 34
34 -
 35
35 -
 36
36 -
 37
37 -
 38
38 -
 39
39 -
 40
40 -
 41
41 -
 42
42 -
 43
43 -
 44
44 -
 45
45 -
46
-
47
-
48
-
49
-
50
-
51
-
52
-
53
-
54
-
55
-
56
-
57
-
58
-
59
-
60
-
61
-
62
-
63
-
64
-
65
-
66
-
67
-
68
-
69
-
70
-
71
-
72
-
73
-
74
-
75
-
76
-
77
-
78
-
79
-
80
-
81
-
82
-
83
-
84
-
85
-
86
-
87
-
88
-
89
-
90
-
91
-
92
 |
 |
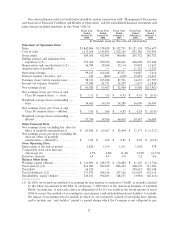
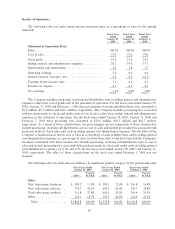
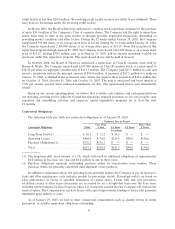
The Company expects the overall gross proÑt as a percentage of sales to decrease in Ñscal 2005 due to the
anticipated launch of two new hardware platforms.
Selling, general and administrative expenses increased by $74.2 million, or 24.8%, from $299.2 million in
Ñscal 2003 to $373.4 million in Ñscal 2004. These increases were primarily attributable to the increase in the
number of stores in operation, and the related increases in store, distribution, and corporate oÇce operating
expenses, the $2.8 million provision for the proposed California labor litigation settlement, the $2.8 million
charge attributable to the professional fees related to the spin-oÅ of our Class B common shares previously
owned by Barnes & Noble and $5.1 million attributable to correcting our method of accounting for rent
expense. Selling, general and administrative expenses as a percentage of sales increased from 19.0% in Ñscal
2003 to 20.2% in Ñscal 2004. The increase in selling, general and administrative expenses as a percentage of
sales was primarily due to the costs associated with the continued rollout of new stores and the eÅect these
stores have on leveraging of selling, general and administrative expenses and investments in our international
infrastructure (a combined impact of 0.6% of sales), the provision for the proposed California labor litigation
settlement (0.2% of sales), the charge attributable to the professional fees related to the spin-oÅ of our
Class B common shares (0.2% of sales) and correcting our method of accounting for rent expense (0.3% of
sales). Management anticipates that the new method of accounting for rent expense will impact selling,
general and administrative expenses in Ñscal 2005 by approximately $2.8 million.
Depreciation and amortization expense increased from $29.4 million in Ñscal 2003 to $36.8 million in
Ñscal 2004. This increase of $7.4 million was due to the capital expenditures for new stores and management
information systems during the Ñscal year. Depreciation and amortization expense will increase from Ñscal
2004 to Ñscal 2005 due to continued capital expenditures for new stores and management information systems
and due to the commencement of full operations in the Company's new distribution facility.
Interest income resulting from the investment of excess cash balances increased from $1.5 million in
Ñscal 2003 to $1.9 million in Ñscal 2004 due to an increase in the level of investments and the average yield on
the investments. Interest expense increased by $1.5 million, from $0.7 million in Ñscal 2003 to $2.2 million in
Ñscal 2004. This increase in interest expense was due to the interest incurred on the note payable to Barnes &
Noble in connection with the repurchase of the Company's Class B common stock. Interest expense on this
note payable is expected to be approximately $2.0 million in Ñscal 2005.
Income tax expense decreased by $3.7 million, from $41.7 million in Ñscal 2003 to $38.0 million in Ñscal
2004. The Company's eÅective tax rate decreased from 39.7% in Ñscal 2003 to 38.4% in Ñscal 2004 due to
corporate restructuring. The eÅective tax rate resulting from the corporate restructuring is expected to recur.
See Note 12 of ""Notes to Consolidated Financial Statements'' of the Company for additional information
regarding income taxes.
The factors described above led to a decrease in operating earnings of $5.3 million, from $104.4 million in
Ñscal 2003 to $99.1 million in Ñscal 2004 and a decrease in net earnings of $2.6 million, or 4.0%, from
$63.5 million in Ñscal 2003 to $60.9 million in Ñscal 2004.
Fiscal 2003 Compared to Fiscal 2002
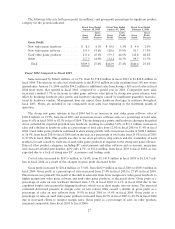
Sales increased by $226.0 million, or 16.7%, from $1,352.8 million in Ñscal 2002 to $1,578.8 million in
Ñscal 2003. The increase in sales was attributable to the $126.3 million in sales resulting from 300 new stores
opened since February 1, 2003 and the $78.1 million in additional sales from having a full year of sales in Ñscal
2003 from stores that opened in Ñscal 2002, compared to a partial year in 2002. Comparable store sales
increased a modest 0.8% as declining video game hardware price points oÅset a signiÑcant increase in video
game software sales. Stores are included in our comparable store sales base beginning in the thirteenth month
of operation.
The declining price points described above led to a decline in hardware sales of $18.7 million, or 8.6%,
and a decline in hardware sales as a percentage of total sales from 16.0% in Ñscal 2002 to 12.6% in Ñscal 2003.
Growth in our store count led to an increase in new video game software sales of $123.2 million, or 23.5%,
from Ñscal 2002 to Ñscal 2003. The shift in sales from hardware led to an increase in new software sales as a
28