GameStop 2004 Annual Report Download - page 71
Download and view the complete annual report
Please find page 71 of the 2004 GameStop annual report below. You can navigate through the pages in the report by either clicking on the pages listed below, or by using the keyword search tool below to find specific information within the annual report.-
 1
1 -
2
-
3
-
4
-
5
-
6
-
7
-
8
-
9
-
10
-
11
-
12
-
13
-
14
-
15
-
16
-
17
-
18
-
19
-
20
-
21
-
22
-
23
-
24
-
25
-
26
-
27
-
28
-
29
-
30
-
31
-
32
-
33
-
34
-
35
-
36
-
37
-
38
-
39
-
40
-
41
-
42
-
43
-
44
-
45
-
46
-
47
-
48
-
49
-
50
-
51
-
52
-
53
-
54
-
55
-
56
-
57
-
58
-
59
-
60
-
 61
61 -
 62
62 -
 63
63 -
 64
64 -
 65
65 -
 66
66 -
 67
67 -
 68
68 -
 69
69 -
 70
70 -
 71
71 -
 72
72 -
 73
73 -
 74
74 -
 75
75 -
 76
76 -
 77
77 -
 78
78 -
 79
79 -
 80
80 -
 81
81 -
82
-
83
-
84
-
85
-
86
-
87
-
88
-
89
-
90
-
91
-
92
 |
 |
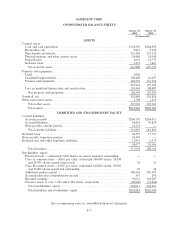
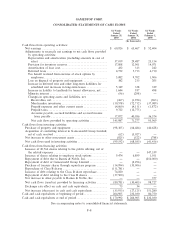
GAMESTOP CORP.
NOTES TO CONSOLIDATED FINANCIAL STATEMENTS Ì (Continued)
Use of Estimates
The preparation of Ñnancial statements in conformity with GAAP requires management to make
estimates and assumptions that aÅect the reported amounts of assets and liabilities, the disclosure of
contingent assets and liabilities at the date of the Ñnancial statements and the reported amounts of revenues
and expenses during the reporting period. In preparing these Ñnancial statements, management has made its
best estimates and judgments of certain amounts included in the Ñnancial statements, giving due consideration
to materiality. Changes in the estimates and assumptions used by management could have signiÑcant impact
on the Company's Ñnancial results. Actual results could diÅer from those estimates.
Fair Values of Financial Instruments
The carrying values of cash and cash equivalents, accounts receivable, accounts payable and the note
payable reported in the accompanying consolidated balance sheets approximate fair value due to the short-
term maturities of these assets.
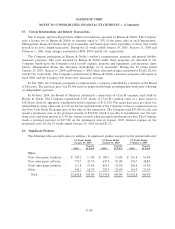
Vendor Concentration
The Company's largest vendors are Electronic Arts, Inc., Nintendo of America, Inc. and Microsoft Corp.,
which accounted for 14%, 13% and 12%, respectively, of the Company's new product purchases in Ñscal 2004.
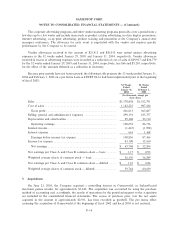
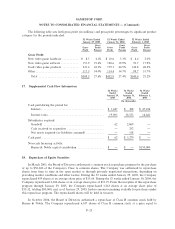
ClassiÑcations
The Company includes purchasing, receiving and distribution costs in selling, general and administrative
expenses, rather than cost of goods sold, in the statement of operations. For the 52 weeks ended January 29,
2005, January 31, 2004 and February 1, 2003 these purchasing, receiving and distribution costs amounted to
$9,203, $9,480 and $10,123, respectively.
The Company includes processing fees associated with purchases made by check and credit cards in cost
of sales, rather than selling, general and administrative expenses, in the statement of operations. For the
52 weeks ended January 29, 2005, January 31, 2004 and February 1, 2003 these processing fees amounted to
$12,014, $10,703 and $10,705, respectively.
ReclassiÑcations
Certain reclassiÑcations have been made to conform the prior period data to the current year
presentation.
2. Vendor Arrangements
The Company and approximately 75 of its vendors participate in cooperative advertising programs and
other vendor marketing programs in which the vendors provide the Company with cash consideration in
exchange for marketing and advertising the vendors' products. Our accounting for cooperative advertising
arrangements and other vendor marketing programs, in accordance with FASB Emerging Issues Task Force
Issue 02-16 or ""EITF 02-16,'' results in a portion of the consideration received from our vendors reducing the
product costs in inventory rather than as an oÅset to our marketing and advertising costs as in years prior to
Ñscal 2003. The consideration serving as a reduction in inventory is recognized in cost of sales as inventory is
sold. The amount of vendor allowances to be recorded as a reduction of inventory was determined by
calculating the ratio of vendor allowances in excess of speciÑc, incremental and identiÑable advertising and
promotional costs to merchandise purchases. The Company then applied this ratio to the value of inventory in
determining the amount of vendor reimbursements to be recorded as a reduction to inventory reÖected on the
balance sheet.
F-15