GameStop 2004 Annual Report Download - page 36
Download and view the complete annual report
Please find page 36 of the 2004 GameStop annual report below. You can navigate through the pages in the report by either clicking on the pages listed below, or by using the keyword search tool below to find specific information within the annual report.-
 1
1 -
2
-
3
-
4
-
5
-
6
-
7
-
8
-
9
-
10
-
11
-
12
-
13
-
14
-
15
-
16
-
17
-
18
-
19
-
20
-
21
-
22
-
23
-
24
-
25
-
 26
26 -
 27
27 -
 28
28 -
 29
29 -
 30
30 -
 31
31 -
 32
32 -
 33
33 -
 34
34 -
 35
35 -
 36
36 -
 37
37 -
 38
38 -
 39
39 -
 40
40 -
 41
41 -
 42
42 -
 43
43 -
 44
44 -
 45
45 -
 46
46 -
47
-
48
-
49
-
50
-
51
-
52
-
53
-
54
-
55
-
56
-
57
-
58
-
59
-
60
-
61
-
62
-
63
-
64
-
65
-
66
-
67
-
68
-
69
-
70
-
71
-
72
-
73
-
74
-
75
-
76
-
77
-
78
-
79
-
80
-
81
-
82
-
83
-
84
-
85
-
86
-
87
-
88
-
89
-
90
-
91
-
92
 |
 |
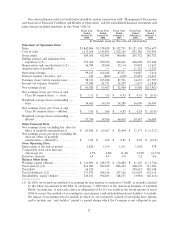
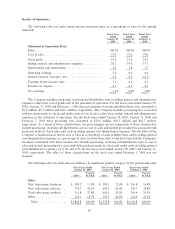
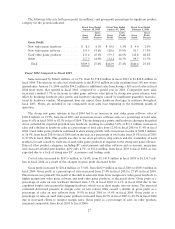
percentage of total sales from 38.8% in Ñscal 2002 to 41.0% in Ñscal 2003. Used video game products
continued to grow due to our store growth in strip centers and eÅorts to increase the consumers' awareness of
the beneÑts of trading in and buying used video game products. Sales of used video game products increased
by $106.9 million, or 36.1%, from Ñscal 2002 to Ñscal 2003 and increased as a percentage of total sales from
21.9% in Ñscal 2002 to 25.5% in Ñscal 2003. Sales of other product categories grew only 4.6%, or $14.6 million,
from Ñscal 2002 to Ñscal 2003, as was expected due to a lack of strong new PC titles.
Cost of sales increased by $133.8 million, or 13.2%, from $1,012.1 million in Ñscal 2002 to $1,145.9 mil-
lion in Ñscal 2003 as a result of the changes in gross proÑt discussed below.
Gross proÑt increased by $92.3 million, or 27.1%, from $340.6 million in Ñscal 2003 to $432.9 million in
Ñscal 2003. Gross proÑt as a percentage of sales increased from 25.2% in Ñscal 2002 to 27.4% in Ñscal 2003.
This increase was primarily the result of the implementation of EITF 02-16 (see footnote 2 to the
Consolidated Financial Statements), requiring certain vendor allowances to be deducted from cost of sales,
and the shift in sales mix from lower margin video game hardware to higher margin PlayStation 2, Game Boy
Advance, Xbox and GameCube video game software and used video game products. The implementation of
EITF 02-16 led to a decrease in cost of sales and a corresponding increase in gross proÑt of $21.6 million, or
1.4% of sales, and led to the increases in gross proÑt as a percentage of sales on new hardware, new software
and other products. Gross proÑt as a percentage of sales declined on used video game products from 48.2% in
Ñscal 2002 to 44.5% in Ñscal 2003 due to increased competition from other retailers expanding their presence
in the used video game business.
Selling, general and administrative expenses increased by $68.7 million, or 29.8%, from $230.5 million in
Ñscal 2002 to $299.2 million in Ñscal 2003. The increase was primarily attributable to the increase in the
number of stores in operation and the related increases in store, distribution, and corporate oÇce operating
expenses. In addition, implementing EITF 02-16 caused an increase of $26.8 million in selling, general and
administrative expenses. Selling, general and administrative expenses as a percentage of sales increased from
17.1% in Ñscal 2002 to 19.0% in Ñscal 2003. The increase in selling, general and administrative expenses as a
percentage of sales was primarily due to the eÅect of implementing EITF 02-16.
Depreciation and amortization expense increased from $23.1 million in Ñscal 2002 to $29.4 million in
Ñscal 2003. This increase of $6.3 million was due to the capital expenditures for new stores, management
information systems and distribution center enhancements during the Ñscal year.
Interest income resulting from the investment of excess cash balances decreased from $2.0 million in
Ñscal 2002 to $1.5 million in Ñscal 2003 due to a decrease in the level of investments and the average yield on
the investments. Interest expense decreased by $0.7 million, from $1.4 million in Ñscal 2002 to $0.7 million in
Ñscal 2003. The decrease was attributable to the repayment of $250.0 million in debt in February 2002 using
the proceeds of the Company's February 2002 public oÅering and the contribution of the remaining
$150.0 million in debt to paid-in-capital by Barnes & Noble.
Income tax expense increased by $6.4 million, from $35.3 million in Ñscal 2002 to $41.7 million in Ñscal
2003. The Company's eÅective tax rate decreased from 40.2% in Ñscal 2002 to 39.7% in Ñscal 2003 due
primarily to tax-exempt interest income and state income tax credits, which are expected to recur. See
Note 12 of ""Notes to Consolidated Financial Statements'' of the Company for additional information
regarding income taxes.
The factors described above led to an increase in operating earnings of $17.3 million, or 19.9%, from
$87.1 million in Ñscal 2002 to $104.4 million in Ñscal 2003 and an increase in net earnings of $11.1 million, or
21.2%, from $52.4 million in Ñscal 2002 to $63.5 million in Ñscal 2003.
Liquidity and Capital Resources
Subsequent to our acquisition by Barnes & Noble in October 1999, and prior to our initial public oÅering
on February 12, 2002, our operations were funded by cash Öows from operations and advances from Barnes &
Noble. Those advances were treated as an intercompany loan owed to Barnes & Noble by us. As of
February 2, 2002, we were indebted to Barnes & Noble in the amount of $399.6 million.
29