GameStop 2004 Annual Report Download - page 73
Download and view the complete annual report
Please find page 73 of the 2004 GameStop annual report below. You can navigate through the pages in the report by either clicking on the pages listed below, or by using the keyword search tool below to find specific information within the annual report.-
 1
1 -
2
-
3
-
4
-
5
-
6
-
7
-
8
-
9
-
10
-
11
-
12
-
13
-
14
-
15
-
16
-
17
-
18
-
19
-
20
-
21
-
22
-
23
-
24
-
25
-
26
-
27
-
28
-
29
-
30
-
31
-
32
-
33
-
34
-
35
-
36
-
37
-
38
-
39
-
40
-
41
-
42
-
43
-
44
-
45
-
46
-
47
-
48
-
49
-
50
-
51
-
52
-
53
-
54
-
55
-
56
-
57
-
58
-
59
-
60
-
61
-
62
-
 63
63 -
 64
64 -
 65
65 -
 66
66 -
 67
67 -
 68
68 -
 69
69 -
 70
70 -
 71
71 -
 72
72 -
 73
73 -
 74
74 -
 75
75 -
 76
76 -
 77
77 -
 78
78 -
 79
79 -
 80
80 -
 81
81 -
 82
82 -
 83
83 -
84
-
85
-
86
-
87
-
88
-
89
-
90
-
91
-
92
 |
 |

GAMESTOP CORP.
NOTES TO CONSOLIDATED FINANCIAL STATEMENTS Ì (Continued)
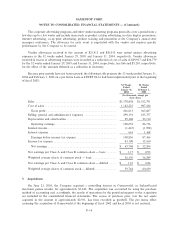
4. Computation of Net Earnings per Common Share
The Company has two classes of common stock and computes earnings per share using the two-class
method in accordance with Financial Accounting Standard No. 128 Earnings per Share. As discussed in
Note 19, the holders of the Company's Class A and Class B common stock have identical rights to dividends
or to distributions in the event of a liquidation, dissolution or winding up of the Company. Accordingly, the
earnings per common share for the two classes of common stock are the same. A reconciliation of shares used
in calculating basic and diluted net earnings per common share follows:
52 Weeks 52 Weeks 52 Weeks
Ended Ended Ended
January 29, January 31, February 1,
2005 2004 2003
(In thousands, except per share data)
Net earnings ÏÏÏÏÏÏÏÏÏÏÏÏÏÏÏÏÏÏÏÏÏÏÏÏÏÏÏÏÏÏÏÏÏÏÏÏÏÏÏÏ $60,926 $63,467 $52,404
Weighted average common shares outstanding
Class A ÏÏÏÏÏÏÏÏÏÏÏÏÏÏÏÏÏÏÏÏÏÏÏÏÏÏÏÏÏÏÏÏÏÏÏÏÏÏÏÏÏÏ 20,683 20,321 20,280
Class BÏÏÏÏÏÏÏÏÏÏÏÏÏÏÏÏÏÏÏÏÏÏÏÏÏÏÏÏÏÏÏÏÏÏÏÏÏÏÏÏÏÏÏ 33,979 36,009 36,009
Weighted common shares outstanding ÏÏÏÏÏÏÏÏÏÏÏÏÏÏÏÏÏ 54,662 56,330 56,289
Dilutive eÅect of options and warrants on Class A common
stockÏÏÏÏÏÏÏÏÏÏÏÏÏÏÏÏÏÏÏÏÏÏÏÏÏÏÏÏÏÏÏÏÏÏÏÏÏÏÏÏÏÏÏÏÏ 3,134 3,434 4,130
Common shares and dilutive potential common shares ÏÏÏÏÏ 57,796 59,764 60,419
Net earnings per Class A and Class B common share:
BasicÏÏÏÏÏÏÏÏÏÏÏÏÏÏÏÏÏÏÏÏÏÏÏÏÏÏÏÏÏÏÏÏÏÏÏÏÏÏÏÏÏÏÏÏÏÏÏ $ 1.11 $ 1.13 $ 0.93
DilutedÏÏÏÏÏÏÏÏÏÏÏÏÏÏÏÏÏÏÏÏÏÏÏÏÏÏÏÏÏÏÏÏÏÏÏÏÏÏÏÏÏÏÏÏÏ $ 1.05 $ 1.06 $ 0.87
The following table contains information on options to purchase shares of Class A common stock which
were excluded from the computation of diluted earnings per share because they were anti-dilutive:
Anti- Range of
Dilutive Exercise Expiration
Shares Prices Dates
(In thousands, except per share data)
52 Weeks Ended January 29, 2005ÏÏÏÏÏÏÏÏÏÏÏ 30 $21.25 2012
52 Weeks Ended January 31, 2004ÏÏÏÏÏÏÏÏÏÏÏ 3,831 $18.00-$21.25 Through 2013
52 Weeks Ended February 1, 2003 ÏÏÏÏÏÏÏÏÏÏÏ 4,372 $16.48-$21.25 Through 2012
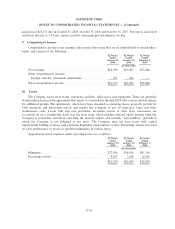
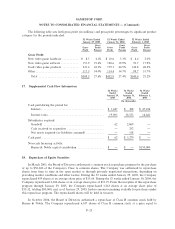
5. Receivables, Net
Receivables represent primarily bankcard and other receivables as follows:
January 29, January 31,
2005 2004
(In thousands)
Bankcard receivables ÏÏÏÏÏÏÏÏÏÏÏÏÏÏÏÏÏÏÏÏÏÏÏÏÏÏÏÏÏÏÏÏÏÏÏÏÏÏÏÏÏÏÏÏ $5,946 $5,147
Other receivables ÏÏÏÏÏÏÏÏÏÏÏÏÏÏÏÏÏÏÏÏÏÏÏÏÏÏÏÏÏÏÏÏÏÏÏÏÏÏÏÏÏÏÏÏÏÏÏ 4,259 4,787
Allowance for doubtful accounts ÏÏÏÏÏÏÏÏÏÏÏÏÏÏÏÏÏÏÏÏÏÏÏÏÏÏÏÏÏÏÏÏÏÏ (393) (389)
Total receivables, net ÏÏÏÏÏÏÏÏÏÏÏÏÏÏÏÏÏÏÏÏÏÏÏÏÏÏÏÏÏÏÏÏÏÏÏÏÏÏÏÏÏÏÏÏ $9,812 $9,545
F-17