GameStop 2004 Annual Report Download - page 34
Download and view the complete annual report
Please find page 34 of the 2004 GameStop annual report below. You can navigate through the pages in the report by either clicking on the pages listed below, or by using the keyword search tool below to find specific information within the annual report.-
 1
1 -
2
-
3
-
4
-
5
-
6
-
7
-
8
-
9
-
10
-
11
-
12
-
13
-
14
-
15
-
16
-
17
-
18
-
19
-
20
-
21
-
22
-
23
-
 24
24 -
 25
25 -
 26
26 -
 27
27 -
 28
28 -
 29
29 -
 30
30 -
 31
31 -
 32
32 -
 33
33 -
 34
34 -
 35
35 -
 36
36 -
 37
37 -
 38
38 -
 39
39 -
 40
40 -
 41
41 -
 42
42 -
 43
43 -
 44
44 -
45
-
46
-
47
-
48
-
49
-
50
-
51
-
52
-
53
-
54
-
55
-
56
-
57
-
58
-
59
-
60
-
61
-
62
-
63
-
64
-
65
-
66
-
67
-
68
-
69
-
70
-
71
-
72
-
73
-
74
-
75
-
76
-
77
-
78
-
79
-
80
-
81
-
82
-
83
-
84
-
85
-
86
-
87
-
88
-
89
-
90
-
91
-
92
 |
 |

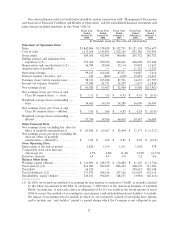
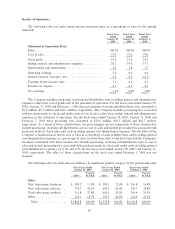
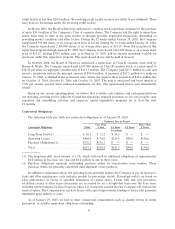
The following table sets forth gross proÑt (in millions) and gross proÑt percentages by signiÑcant product
category for the periods indicated:
Fiscal Year Ended Fiscal Year Ended Fiscal Year Ended
January 29, 2005 January 31, 2004 February 1, 2003
Gross Gross Gross
Gross ProÑt Gross ProÑt Gross ProÑt
ProÑt Percent ProÑt Percent ProÑt Percent
Gross ProÑt:
New video game hardware ÏÏÏÏÏÏÏÏÏÏÏ $ 8.5 4.1% $ 10.6 5.3% $ 4.4 2.0%
New video game software ÏÏÏÏÏÏÏÏÏÏÏÏ 151.9 19.6% 128.6 19.9% 93.7 17.9%
Used video game products ÏÏÏÏÏÏÏÏÏÏÏ 231.6 45.3% 179.3 44.5% 142.8 48.2%
Other ÏÏÏÏÏÏÏÏÏÏÏÏÏÏÏÏÏÏÏÏÏÏÏÏÏÏÏÏÏ 117.3 34.0% 114.4 34.7% 99.7 31.7%
Total ÏÏÏÏÏÏÏÏÏÏÏÏÏÏÏÏÏÏÏÏÏÏÏÏÏÏÏ $509.3 27.6% $432.9 27.4% $340.6 25.2%
Fiscal 2004 Compared to Fiscal 2003
Sales increased by $264.0 million, or 16.7%, from $1,578.8 million in Ñscal 2003 to $1,842.8 million in
Ñscal 2004. The increase in sales was attributable to the $139.0 million in sales resulting from 338 new stores
opened since January 31, 2004 and the $94.2 million in additional sales from having a full year of sales in Ñscal
2004 from stores that opened in Ñscal 2003, compared to a partial year in 2003. Comparable store sales
increased a modest 1.7% as increases in video game software sales driven by strong new game releases were
oÅset by declining hardware price points and hardware shortages caused by insuÇcient quantities manufac-
tured by hardware vendors. Management does not expect these hardware shortages to continue throughout
Ñscal 2005. Stores are included in our comparable store sales base beginning in the thirteenth month of
operation.
The strong new game releases in Ñscal 2004 led to an increase in new video game software sales of
$128.8 million, or 19.9%, from Ñscal 2003 and an increase in new software sales as a percentage of total sales
from 41.0% in Ñscal 2003 to 42.1% in Ñscal 2004. The declining price points and hardware shortages described
above curtailed the expected growth in new hardware, resulting in a modest 5.6%, or $11.1 million, increase in
sales and a decline in hardware sales as a percentage of total sales from 12.6% in Ñscal 2003 to 11.4% in Ñscal
2004. Used video game products continued to show strong growth, with an increase in sales of $108.5 million,
or 26.9%, from Ñscal 2003 to Ñscal 2004 and an increase as a percentage of total sales from 25.5% in Ñscal 2003
to 27.8% in Ñscal 2004. This growth was due to our store growth in strip centers and the availability of used
products for sale caused by trade-ins of used video game products in response to the strong new game releases.
Sales of other product categories, including PC entertainment and other software and accessories, magazines
and character-related merchandise, grew only 4.7%, or $15.6 million, from Ñscal 2003 to Ñscal 2004, as was
expected due to a lack of strong new PC accessories and trading cards.
Cost of sales increased by $187.6 million, or 16.4%, from $1,145.9 million in Ñscal 2003 to $1,333.5 mil-
lion in Ñscal 2004 as a result of the changes in gross proÑt discussed below.
Gross proÑt increased by $76.4 million, or 17.6%, from $432.9 million in Ñscal 2003 to $509.3 million in
Ñscal 2004. Gross proÑt as a percentage of sales increased from 27.4% in Ñscal 2003 to 27.6% in Ñscal 2004.
This increase was primarily the result of the shift in sales mix from lower margin new video game hardware to
higher margin new video game software and used video game products, as discussed above. Gross proÑt as a
percentage of sales on new hardware declined from 5.3% in Ñscal 2003 to 4.1% in Ñscal 2004 due to the
expedited freight costs incurred in shipping hardware, which was in short supply, into our stores. The expected
continued downward pressure in margin rates on new release titles caused a decline in gross proÑt as a
percentage of sales on new software from 19.9% in Ñscal 2003 to 19.6% in Ñscal 2004. Gross proÑt as a
percentage of sales on used video game products increased from 44.5% in Ñscal 2003 to 45.3% in Ñscal 2004
due to increased eÅorts to monitor margin rates. Gross proÑt as a percentage of sales on other products
remained comparable from Ñscal 2003 to Ñscal 2004.
27