Frontier Communications 2013 Annual Report Download - page 98
Download and view the complete annual report
Please find page 98 of the 2013 Frontier Communications annual report below. You can navigate through the pages in the report by either clicking on the pages listed below, or by using the keyword search tool below to find specific information within the annual report.-
 1
1 -
2
-
3
-
4
-
5
-
6
-
7
-
8
-
9
-
10
-
11
-
12
-
13
-
14
-
15
-
16
-
17
-
18
-
19
-
20
-
21
-
22
-
23
-
24
-
25
-
26
-
27
-
28
-
29
-
30
-
31
-
32
-
33
-
34
-
35
-
36
-
37
-
38
-
39
-
40
-
41
-
42
-
43
-
44
-
45
-
46
-
47
-
48
-
49
-
50
-
51
-
52
-
53
-
54
-
55
-
56
-
57
-
58
-
59
-
60
-
61
-
62
-
63
-
64
-
65
-
66
-
67
-
68
-
69
-
70
-
71
-
72
-
73
-
74
-
75
-
76
-
77
-
78
-
79
-
80
-
81
-
82
-
83
-
84
-
85
-
86
-
87
-
 88
88 -
 89
89 -
 90
90 -
 91
91 -
 92
92 -
 93
93 -
 94
94 -
 95
95 -
 96
96 -
 97
97 -
 98
98 -
 99
99 -
 100
100 -
 101
101 -
 102
102 -
 103
103 -
 104
104 -
 105
105 -
 106
106
 |
 |

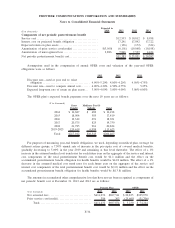
($ in thousands)
Expected in
2014 2013 2012 2011
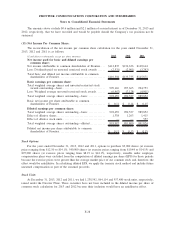
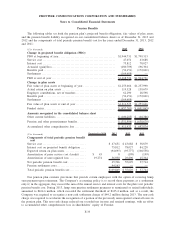
Components of net periodic postretirement benefit
Service cost ................................................ $12,533 $ 10,812 $ 8,958
Interest cost on projected benefit obligation .................. 17,241 17,842 17,722
Expected return on plan assets............................... (136) (172) (324)
Amortization of prior service cost/(credit) .................... $(3,560) (6,101) (10,068) (10,198)
Amortization of unrecognized loss ........................... 2,886 7,846 7,537 4,424
Net periodic postretirement benefit cost ...................... $31,383 $ 25,951 $ 20,582
Assumptions used in the computation of annual OPEB costs and valuation of the year-end OPEB
obligations were as follows:
2013 2012 2011
Discount rate—used at year end to value
obligation . . . .................................. 4.90%-5.20% 4.00%-4.20% 4.50%-4.75%
Discount rate—used to compute annual cost ....... 4.00%-4.20% 4.50%-4.75% 5.25%
Expected long-term rate of return on plan assets. . . 3.00%-4.00% 3.00%-4.00% 3.00%-6.00%
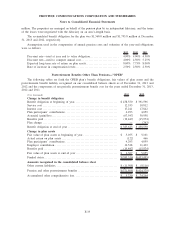
The OPEB plan’s expected benefit payments over the next 10 years are as follows:
($ in thousands)
Gross
Benefit
Medicare Part D
Subsidy Total
2014 $ 16,687 $ 489 $ 16,198
2015 18,004 585 17,419
2016 19,342 691 18,651
2017 20,575 825 19,750
2018 21,785 961 20,824
2019-2023 120,619 6,994 113,625
Total $217,012 $10,545 $206,467
For purposes of measuring year-end benefit obligations, we used, depending on medical plan coverage for
different retiree groups, a 7.50% annual rate of increase in the per-capita cost of covered medical benefits,
gradually decreasing to 5.00% in the year 2019 and remaining at that level thereafter. The effect of a 1%
increase in the assumed medical cost trend rates for each future year on the aggregate of the service and interest
cost components of the total postretirement benefit cost would be $1.1 million and the effect on the
accumulated postretirement benefit obligation for health benefits would be $14.8 million. The effect of a 1%
decrease in the assumed medical cost trend rates for each future year on the aggregate of the service and
interest cost components of the total postretirement benefit cost would be $(1.0) million and the effect on the
accumulated postretirement benefit obligation for health benefits would be $(13.8) million.
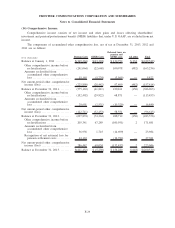
The amounts in accumulated other comprehensive loss that have not yet been recognized as components of
net periodic benefit cost at December 31, 2013 and 2012 are as follows:
($ in thousands) 2013 2012 2013 2012
Pension Plan OPEB
Net actuarial loss ................................. $411,076 $697,511 $ 30,835 $105,970
Prior service cost/(credit) . . ........................ 356 363 (25,605) (31,706)
Total......................................... $411,432 $697,874 $ 5,230 $ 74,264
F-36
FRONTIER COMMUNICATIONS CORPORATION AND SUBSIDIARIES
Notes to Consolidated Financial Statements