Frontier Communications 2013 Annual Report Download - page 49
Download and view the complete annual report
Please find page 49 of the 2013 Frontier Communications annual report below. You can navigate through the pages in the report by either clicking on the pages listed below, or by using the keyword search tool below to find specific information within the annual report.-
 1
1 -
2
-
3
-
4
-
5
-
6
-
7
-
8
-
9
-
10
-
11
-
12
-
13
-
14
-
15
-
16
-
17
-
18
-
19
-
20
-
21
-
22
-
23
-
24
-
25
-
26
-
27
-
28
-
29
-
30
-
31
-
32
-
33
-
34
-
35
-
36
-
37
-
38
-
 39
39 -
 40
40 -
 41
41 -
 42
42 -
 43
43 -
 44
44 -
 45
45 -
 46
46 -
 47
47 -
 48
48 -
 49
49 -
 50
50 -
 51
51 -
 52
52 -
 53
53 -
 54
54 -
 55
55 -
 56
56 -
 57
57 -
 58
58 -
 59
59 -
60
-
61
-
62
-
63
-
64
-
65
-
66
-
67
-
68
-
69
-
70
-
71
-
72
-
73
-
74
-
75
-
76
-
77
-
78
-
79
-
80
-
81
-
82
-
83
-
84
-
85
-
86
-
87
-
88
-
89
-
90
-
91
-
92
-
93
-
94
-
95
-
96
-
97
-
98
-
99
-
100
-
101
-
102
-
103
-
104
-
105
-
106
 |
 |

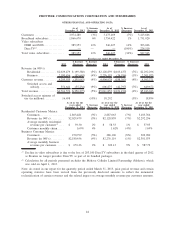
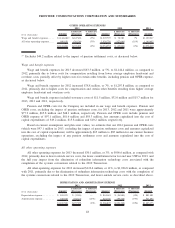
OTHER OPERATING EXPENSES
($ in thousands) Amount
$ Increase
(Decrease)
% Increase
(Decrease) Amount
$ Increase
(Decrease)
% Increase
(Decrease) Amount
2013 2012 2011
Wage and benefit expenses . . . . . . $1,144,448(1) $(63,349) (5%) $1,207,797 $ 78,780 7% $1,129,017
All other operating expenses. . . . . 996,620 (30,136) (3%) 1,026,756 (122,646) (11%) 1,149,402
$2,141,068 $(93,485) (4%) $2,234,553 $ (43,866) (2%) $2,278,419
(1) Excludes $44.2 million related to the impact of pension settlement costs, as discussed below.
Wage and benefit expenses
Wage and benefit expenses for 2013 decreased $63.3 million, or 5%, to $1,144.4 million, as compared to
2012, primarily due to lower costs for compensation resulting from lower average employee headcount and
overtime costs, partially offset by higher costs for certain other benefits, including pension and OPEB expense,
as discussed below.
Wage and benefit expenses for 2012 increased $78.8 million, or 7%, to $1,207.8 million, as compared to
2011, primarily due to higher costs for compensation and certain other benefits resulting from higher average
employee headcount and overtime costs.
Wage and benefit expenses included severance costs of $11.5 million, $32.0 million and $15.7 million for
2013, 2012 and 2011, respectively.
Pension and OPEB costs for the Company are included in our wage and benefit expenses. Pension and
OPEB costs, excluding the impact of pension settlement costs, for 2013, 2012 and 2011 were approximately
$77.9 million, $65.8 million and $48.1 million, respectively. Pension and OPEB costs include pension and
OPEB expense of $97.1 million, $81.6 million and $58.3 million, less amounts capitalized into the cost of
capital expenditures of $19.2 million, $15.8 million and $10.2 million, respectively.
Based on current assumptions and plan asset values, we estimate that our 2014 pension and OPEB costs
(which were $97.1 million in 2013, excluding the impact of pension settlement costs and amounts capitalized
into the cost of capital expenditures) will be approximately $65 million to $85 million for our current business
operations, excluding the impact of any pension settlement costs and amounts capitalized into the cost of
capital expenditures.
All other operating expenses
All other operating expenses for 2013 decreased $30.1 million, or 3%, to $996.6 million, as compared with
2012, primarily due to lower outside service costs, the lower contribution factor for end user USF in 2013, and
the full year impact from the elimination of redundant information technology costs associated with the
completion of the systems conversions related to the 2010 Transaction.
All other operating expenses for 2012 decreased $122.6 million, or 11%, to $1,026.8 million, as compared
with 2011, primarily due to the elimination of redundant information technology costs with the completion of
the systems conversions related to the 2010 Transaction, and lower outside service costs, as described above.
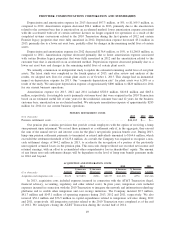
DEPRECIATION AND AMORTIZATION EXPENSE
($ in thousands) Amount
$ Increase
(Decrease)
% Increase
(Decrease) Amount
$ Increase
(Decrease)
% Increase
(Decrease) Amount
2013 2012 2011
Depreciation expense. . . . . . . . . . . . $ 841,455 $ (3,186) — $ 844,641 $ (36,840) (4%) $ 881,481
Amortization expense . . . . . . . . . . . 328,045 (94,121) (22%) 422,166 (99,528) (19%) 521,694
$1,169,500 $(97,307) (8%) $1,266,807 $(136,368) (10%) $1,403,175
48
FRONTIER COMMUNICATIONS CORPORATION AND SUBSIDIARIES