Frontier Communications 2013 Annual Report Download - page 9
Download and view the complete annual report
Please find page 9 of the 2013 Frontier Communications annual report below. You can navigate through the pages in the report by either clicking on the pages listed below, or by using the keyword search tool below to find specific information within the annual report.-
 1
1 -
 2
2 -
 3
3 -
 4
4 -
 5
5 -
 6
6 -
 7
7 -
 8
8 -
 9
9 -
 10
10 -
 11
11 -
 12
12 -
 13
13 -
 14
14 -
 15
15 -
 16
16 -
 17
17 -
 18
18 -
 19
19 -
 20
20 -
21
-
22
-
23
-
24
-
25
-
26
-
27
-
28
-
29
-
30
-
31
-
32
-
33
-
34
-
35
-
36
-
37
-
38
-
39
-
40
-
41
-
42
-
43
-
44
-
45
-
46
-
47
-
48
-
49
-
50
-
51
-
52
-
53
-
54
-
55
-
56
-
57
-
58
-
59
-
60
-
61
-
62
-
63
-
64
-
65
-
66
-
67
-
68
-
69
-
70
-
71
-
72
-
73
-
74
-
75
-
76
-
77
-
78
-
79
-
80
-
81
-
82
-
83
-
84
-
85
-
86
-
87
-
88
-
89
-
90
-
91
-
92
-
93
-
94
-
95
-
96
-
97
-
98
-
99
-
100
-
101
-
102
-
103
-
104
-
105
-
106
 |
 |

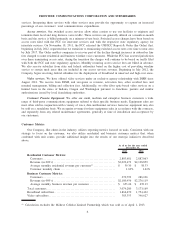
The following table sets forth total residential customers by state as of December 31, 2013:
State
Residential
customers
Percentage of
residential
customers
West Virginia............................. 336,092 12.0%
New York ................................ 278,111 9.9%
Indiana . .................................. 277,663 9.9%
Illinois . .................................. 267,043 9.5%
Ohio . . . .................................. 248,894 8.9%
Michigan ................................. 201,031 7.2%
Washington ............................... 200,810 7.2%
Oregon . .................................. 145,569 5.2%
Wisconsin ................................ 135,347 4.8%
Pennsylvania.............................. 127,381 4.5%
Minnesota ................................ 103,625 3.7%
North Carolina . . . ......................... 102,493 3.7%
California................................. 76,166 2.7%
Arizona. .................................. 69,704 2.5%
Idaho. . . .................................. 53,558 1.9%
South Carolina . . . ......................... 42,639 1.5%
Other States (1) ............................ 137,355 4.9%
Total . . . .................................. 2,803,481 100%
Total business customers ................ 270,799
Total customers......................... 3,074,280
(1) Includes Tennessee, Nevada, Iowa, Nebraska, Alabama, Utah, Georgia, Montana, New Mexico, Mississippi
and Florida.
Network Architecture and Technology
Our local exchange carrier networks consist of host central office and remote sites, primarily equipped
with digital and Internet Protocol switches. The outside plant consists of transport and distribution delivery
networks connecting our host central office with remote central offices and ultimately with our customers. We
own fiber optic and copper cable, which has been deployed in our networks and are the primary transport
technologies between our host and remote central offices and interconnection points with other incumbent
carriers.
Our fiber optic and copper transport system is capable of supporting increasing customer demand for high
bandwidth transport services. We routinely enhance our network and are currently upgrading with the latest
Internet Protocol Transport and routing equipment, Reconfigurable Optical Add/Drop Multiplexers (ROADM)
transport systems, Very High Bit-Rate Digital Subscriber Line (VDSL) broadband equipment, and VoIP
switches. These systems will support advanced services such as Ethernet, Dedicated Internet, Multiprotocol
Label Switching (MPLS) transport, and VoIP. The network is designed with redundancy and auto-failover
capability on our major circuits.
8
FRONTIER COMMUNICATIONS CORPORATION AND SUBSIDIARIES