Frontier Communications 2013 Annual Report Download - page 44
Download and view the complete annual report
Please find page 44 of the 2013 Frontier Communications annual report below. You can navigate through the pages in the report by either clicking on the pages listed below, or by using the keyword search tool below to find specific information within the annual report.-
 1
1 -
2
-
3
-
4
-
5
-
6
-
7
-
8
-
9
-
10
-
11
-
12
-
13
-
14
-
15
-
16
-
17
-
18
-
19
-
20
-
21
-
22
-
23
-
24
-
25
-
26
-
27
-
28
-
29
-
30
-
31
-
32
-
33
-
 34
34 -
 35
35 -
 36
36 -
 37
37 -
 38
38 -
 39
39 -
 40
40 -
 41
41 -
 42
42 -
 43
43 -
 44
44 -
 45
45 -
 46
46 -
 47
47 -
 48
48 -
 49
49 -
 50
50 -
 51
51 -
 52
52 -
 53
53 -
 54
54 -
55
-
56
-
57
-
58
-
59
-
60
-
61
-
62
-
63
-
64
-
65
-
66
-
67
-
68
-
69
-
70
-
71
-
72
-
73
-
74
-
75
-
76
-
77
-
78
-
79
-
80
-
81
-
82
-
83
-
84
-
85
-
86
-
87
-
88
-
89
-
90
-
91
-
92
-
93
-
94
-
95
-
96
-
97
-
98
-
99
-
100
-
101
-
102
-
103
-
104
-
105
-
106
 |
 |
increases in data services revenue and increases in subscriber line charges due to additional access recovery
charges. These access recovery charges are a result of regulatory changes related to Intercarrier Compensation
reform and are expected to continue to increase, as allowed by the FCC to partially offset regulatory mandated
declines in switched access rates. We had approximately 2,803,500, 2,887,100 and 3,103,800 total residential
customers as of December 31, 2013, 2012 and 2011, respectively. We lost approximately 83,600, 216,700 and
341,400 residential customers during the years ended December 31, 2013, 2012 and 2011, respectively,
principally driven by declines in voice customers, and our residential customer monthly churn was 1.69%,
1.62% and 1.69% for the years ended December 31, 2013, 2012 and 2011, respectively. The overall increase in
residential ARPC is primarily due to additional broadband and Frontier Secure customers at a higher ARPC and
declining counts in voice-only customers at a lower ARPC. The Company expects continuing improvements in
data services revenue, primarily driven by increased broadband subscribers, and continuing declines in voice
services revenue.
Average monthly business revenue per customer (business ARPC) increased $14.13, or 2%, to $653.26
during 2013 as compared to 2012. Total business revenue for the year ended December 31, 2013 declined $95.7
million, or 4%, as compared to the year ended December 31, 2012, principally as a result of decreases in our
local and long distance voice revenues. We lost approximately 15,300, 23,800 and 34,000 business customers
during the years ended December 31, 2013, 2012 and 2011, respectively. The overall increase in business
ARPC is primarily due to declining customer counts for our small business customers that carry a lower ARPC.
The Company expects the declines in local and long distance voice revenues from business customers to
continue.
During the year ended December 31, 2013, the Company added approximately 112,250 net broadband
subscribers. During 2012 and 2011, the Company added approximately 23,400 and 45,200 net broadband
subscribers, respectively. As of December 31, 2013, approximately 76% of our residential broadband
customers, excluding multiple dwelling units and wireless high speed internet, subscribed to a bundle of
services. As of December 31, 2013, we were able to offer broadband to approximately 6.4 million households,
or 90% of the 7.1 million households in our markets. The increase in broadband subscribers contributed to our
improved revenue performance. We continue to invest in network speed and capacity to support our goal of
increasing broadband penetration and market share. We expect to continue to increase broadband subscribers in
2014.
Management believes that customer counts and average monthly revenue per customer are important
factors in evaluating our trends. Among the key services we provide to residential customers are voice service,
data service, video service, and, in some markets, wireless service. We continue to explore the potential to
provide additional services to our customer base, with the objective of meeting all of our customers’
communications needs, as well as increasing revenue per customer. For business customers we provide voice
and data services, as well as a broad range of value-added services.
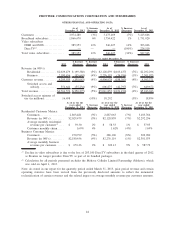
In the section “Other Financial and Operating Data” below is a table that presents customer counts,
average monthly revenue per customer and customer churn. It also categorizes revenue into customer revenue
(residential and business) and regulatory revenue (switched access and subsidy revenue). The decline in the
number of customers was partially offset by increased penetration of additional higher revenue generating
products sold to both residential and business customers, which has increased our average monthly revenue per
customer. Economic conditions, a substantial further loss of customers, and increasing competition could make
it more difficult to sell our bundled service offerings, and cause us to increase our promotions and/or lower our
prices for our products and services, which could adversely affect our revenue, profitability and cash flows.
43
FRONTIER COMMUNICATIONS CORPORATION AND SUBSIDIARIES