Frontier Communications 2013 Annual Report Download - page 76
Download and view the complete annual report
Please find page 76 of the 2013 Frontier Communications annual report below. You can navigate through the pages in the report by either clicking on the pages listed below, or by using the keyword search tool below to find specific information within the annual report.-
 1
1 -
2
-
3
-
4
-
5
-
6
-
7
-
8
-
9
-
10
-
11
-
12
-
13
-
14
-
15
-
16
-
17
-
18
-
19
-
20
-
21
-
22
-
23
-
24
-
25
-
26
-
27
-
28
-
29
-
30
-
31
-
32
-
33
-
34
-
35
-
36
-
37
-
38
-
39
-
40
-
41
-
42
-
43
-
44
-
45
-
46
-
47
-
48
-
49
-
50
-
51
-
52
-
53
-
54
-
55
-
56
-
57
-
58
-
59
-
60
-
61
-
62
-
63
-
64
-
65
-
 66
66 -
 67
67 -
 68
68 -
 69
69 -
 70
70 -
 71
71 -
 72
72 -
 73
73 -
 74
74 -
 75
75 -
 76
76 -
 77
77 -
 78
78 -
 79
79 -
 80
80 -
 81
81 -
 82
82 -
 83
83 -
 84
84 -
 85
85 -
 86
86 -
87
-
88
-
89
-
90
-
91
-
92
-
93
-
94
-
95
-
96
-
97
-
98
-
99
-
100
-
101
-
102
-
103
-
104
-
105
-
106
 |
 |

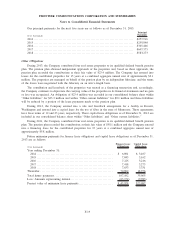
(5) Property, Plant and Equipment:
Property, plant and equipment, net at December 31, 2013 and 2012 are as follows:
($ in thousands)
Estimated
Useful Lives 2013 2012
Land ...................................................... N/A $ 126,483 $ 126,483
Buildings and leasehold improvements . . . ................... 41 years 1,061,097 1,052,650
General support ............................................ 5 to 17 years 977,941 988,707
Central office/electronic circuit equipment ................... 5 to 11 years 5,222,928 4,965,099
Poles ...................................................... 49 years 549,322 507,922
Cable and wire............................................. 15 to 30 years 6,259,292 6,038,835
Conduit.................................................... 60 years 359,974 354,777
Other ...................................................... 12 to 30 years 43,144 44,802
Construction work in progress . . ............................ 250,516 274,488
Property, plant and equipment . . ............................ 14,850,697 14,353,763
Less: Accumulated depreciation . ............................ (7,594,935) (6,848,867)
Property, plant and equipment, net .......................... $ 7,255,762 $ 7,504,896
Depreciation expense is principally based on the composite group method. Depreciation expense was
$841.5 million, $844.6 million and $881.5 million for the years ended December 31, 2013, 2012 and 2011,
respectively. As a result of an independent study of the estimated remaining useful lives of our plant assets, we
adopted new estimated remaining useful lives for certain plant assets as of October 1, 2013, with an immaterial
impact to depreciation expense.
(6) Goodwill and Other Intangibles:
The components of goodwill by the reporting units in effect as of December 31, 2013 are as follows:
($ in thousands)
Central .................................................................. $1,815,498
East..................................................................... 2,003,574
National. . . .............................................................. 1,218,113
West .................................................................... 1,300,534
Total Goodwill. ..................................................... $6,337,719
The components of other intangibles at December 31, 2013 and 2012 are as follows:
($ in thousands)
Gross Carrying
Amount
Accumulated
Amortization
Net Carrying
Amount
Gross Carrying
Amount
Accumulated
Amortization
Net Carrying
Amount
2013 2012
Other Intangibles:
Customer base. . . ...... $2,427,648 $(1,336,852) $1,090,796 $2,427,648 $(1,009,045) $1,418,603
Software licenses ...... — — — 105,019 (105,019) —
Trade name and
license.............. 124,136 — 124,136 124,419 (283) 124,136
Total other
intangibles . . ...... $2,551,784 $(1,336,852) $1,214,932 $2,657,086 $(1,114,347) $1,542,739
Amortization expense was $328.0 million, $422.2 million and $521.7 million for the years ended
December 31, 2013, 2012 and 2011, respectively. Amortization expense for 2013, 2012 and 2011 of $328.0
million, $410.8 million and $465.4 million, respectively, mainly represents the amortization of intangible assets
(primarily customer base) that were acquired in the 2010 Transaction based on a useful life of nine years for
the residential customer base and 12 years for the business customer base, amortized on an accelerated method.
Amortization expense for 2012 and 2011 included $38.3 million and $49.1 million, respectively, for
F-14
FRONTIER COMMUNICATIONS CORPORATION AND SUBSIDIARIES
Notes to Consolidated Financial Statements