Frontier Communications 2013 Annual Report Download - page 48
Download and view the complete annual report
Please find page 48 of the 2013 Frontier Communications annual report below. You can navigate through the pages in the report by either clicking on the pages listed below, or by using the keyword search tool below to find specific information within the annual report.-
 1
1 -
2
-
3
-
4
-
5
-
6
-
7
-
8
-
9
-
10
-
11
-
12
-
13
-
14
-
15
-
16
-
17
-
18
-
19
-
20
-
21
-
22
-
23
-
24
-
25
-
26
-
27
-
28
-
29
-
30
-
31
-
32
-
33
-
34
-
35
-
36
-
37
-
 38
38 -
 39
39 -
 40
40 -
 41
41 -
 42
42 -
 43
43 -
 44
44 -
 45
45 -
 46
46 -
 47
47 -
 48
48 -
 49
49 -
 50
50 -
 51
51 -
 52
52 -
 53
53 -
 54
54 -
 55
55 -
 56
56 -
 57
57 -
 58
58 -
59
-
60
-
61
-
62
-
63
-
64
-
65
-
66
-
67
-
68
-
69
-
70
-
71
-
72
-
73
-
74
-
75
-
76
-
77
-
78
-
79
-
80
-
81
-
82
-
83
-
84
-
85
-
86
-
87
-
88
-
89
-
90
-
91
-
92
-
93
-
94
-
95
-
96
-
97
-
98
-
99
-
100
-
101
-
102
-
103
-
104
-
105
-
106
 |
 |

We initially recorded such funds as increases to Cash and Other liabilities in the balance sheet. We spent $37.6
million of the previously received CAF funds on network expansion through December 31, 2013.
On May 21, 2013, the FCC released a Report and Order authorizing a second round of CAF Phase I. As
part of this May 2013 Report and Order, the FCC expanded the areas eligible for funding to include those that
lack service of 3Mbps download and 768 kbps upload. In 2013, Frontier applied for funds from the second
round of CAF Phase I and in December 2013 the FCC awarded $57.6 million to us to serve 94,899 locations in
our high-cost, unserved and underserved areas across multiple states. The FCC also announced on January 10,
2014, that Frontier was eligible for an additional $3.7 million in funding to serve 6,815 locations. We may need
to match a portion of the funding received from the second round of CAF Phase I to support these projects.
The Order also makes changes to Intercarrier Compensation. Intercarrier Compensation, which is the
payment framework that governs how carriers compensate each other for the exchange of interstate traffic,
began a multi-year transition in July 2012, with the second step implemented in July 2013. The transition will
move terminating traffic to a near zero rate by 2017. We expect to be able to recover a significant portion of
those revenues through end user rates and other replacement support mechanisms. These changes did not have a
material impact on our revenues in 2013.
Effective December 29, 2011, the Order required providers to pay interstate access rates for the
termination of VoIP toll traffic. On April 25, 2012, the FCC, in an Order on Reconsideration, specified that
changes to originating access rates for VoIP traffic will not be implemented until July 2014. The Order has
been challenged by certain parties in court and certain parties have also petitioned the FCC to reconsider
various aspects of the Order. The net impact of the Order during the second half of 2012 and the full year of
2013 was immaterial.
Certain states also have their own open proceedings to address reform to intrastate access charges and
other intercarrier compensation and state universal service funds. Although the FCC has pre-empted state
jurisdiction on most access charges, many states could consider moving forward with their proceedings. We
cannot predict when or how these matters will be decided or the effect on our subsidy or switched access
revenues.
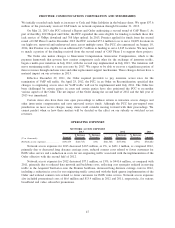
OPERATING EXPENSES
NETWORK ACCESS EXPENSES
($ in thousands) Amount
$ Increase
(Decrease)
% Increase
(Decrease) Amount
$ Increase
(Decrease)
% Increase
(Decrease) Amount
2013 2012 2011
Network access expenses . . . . . . . . . . . . . $431,073 $(10,515) (2%) $441,588 $(77,094) (15%) $518,682
Network access expenses for 2013 decreased $10.5 million, or 2%, to $431.1 million, as compared 2012,
primarily due to decreased long distance carriage costs, reduced content costs related to fewer customers for
FiOS video service and a reduction in costs for our originating traffic associated with the implementation of the
Order effective with the second half of 2012.
Network access expenses for 2012 decreased $77.1 million, or 15%, to $441.6 million, as compared with
2011, primarily due to reduced data network and backbone costs, reflecting cost synergies realized in moving
traffic in the Acquired Territories onto the Frontier backbone, decreased long distance carriage costs in 2012,
including a reduction in costs for our originating traffic associated with the third quarter implementation of the
Order and reduced content costs related to fewer customers for FiOS video service. Network access expenses
also included promotional costs of $6.6 million and $13.9 million in 2012 and 2011, respectively, for various
broadband and video subscriber promotions.
47
FRONTIER COMMUNICATIONS CORPORATION AND SUBSIDIARIES