Frontier Communications 2013 Annual Report Download - page 46
Download and view the complete annual report
Please find page 46 of the 2013 Frontier Communications annual report below. You can navigate through the pages in the report by either clicking on the pages listed below, or by using the keyword search tool below to find specific information within the annual report.
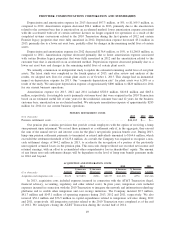
REVENUE
($ in thousands) Amount
$ Increase
(Decrease)
% Increase
(Decrease) Amount
$ Increase
(Decrease)
% Increase
(Decrease) Amount
2013 2012 2011
Local and long distance services. . . . . . $2,044,631 $(198,001) (9%) $2,242,632 $(233,883) (9%) $2,476,515
Data and internet services . ........... 1,866,461 61,110 3% 1,805,351 (8,652) — 1,814,003
Other . .............................. 298,843 (58,152) (16%) 356,995 54,142 18% 302,853
Customer revenue. . . . . . . . . ........... 4,209,935 (195,043) (4%) 4,404,978 (188,393) (4%) 4,593,371
Switched access and subsidy . . . . . . . . . 551,641 (55,234) (9%) 606,875 (42,797) (7%) 649,672
Total revenue . . . . . . . . ........... $4,761,576 $(250,277) (5%) $5,011,853 $(231,190) (4%) $5,243,043
Local and Long Distance Services
Local and long distance services revenue for 2013 decreased $198.0 million, or 9%, to $2,044.6 million, as
compared with 2012, primarily due to the continued loss of voice customers and, to a lesser extent, decreases in
long distance services revenue and individual features packages, partially offset by increased local voice
charges to residential and business end users to the extent permitted by the Order. Local and enhanced services
revenue for 2013 decreased $137.6 million, or 8%, to $1,681.0 million, primarily due to the continued loss of
voice customers and, to a lesser extent, decreases in individual features packages, partially offset by increased
local voice charges to residential and business end users to the extent permitted by the Order. Long distance
services revenue for 2013 decreased $60.4 million, or 14%, to $363.6 million, primarily due to lower minutes
of use driven by fewer customers and the migration to bundled packages.
Local and long distance services revenue for 2012 decreased $233.9 million, or 9%, to $2,242.6 million, as
compared with 2011 primarily due to the continued loss of voice customers and, to a lesser extent, decreases in
private line services and feature packages, partially offset by increased local charges, effective with the third
quarter of 2012, to business and residential end users to the extent permitted by the Order. Local and enhanced
services revenue for 2012 decreased $181.3 million, or 9%, to $1,818.6 million, primarily due to the continued
loss of voice customers and, to a lesser extent, decreases in private line services and feature packages, partially
offset by increased local charges, effective with the third quarter of 2012, to business and residential end users
to the extent permitted by the Order. Long distance services revenue for 2012 decreased $52.6 million, or 11%,
to $424.0 million, primarily due to a decrease in the number of long distance customers using our bundled
service offerings, lower minutes of use and a lower average revenue per minute of use.
Data and Internet Services
Data and Internet services revenue for 2013 increased $61.1 million, or 3%, to $1,866.5 million, as
compared with 2012. Data services revenue increased $85.1 million, or 10%, to $930.7 million in 2013, as
compared with 2012, primarily due to increases in the number of broadband customers and sales of Frontier
Secure products. As of December 31, 2013, the number of the Company’s broadband subscribers increased by
approximately 112,250, or 6%, since December 31, 2012. Data and Internet services also includes nonswitched
access revenue from data transmission services to other carriers and high-volume business customers with
dedicated high-capacity Internet and Ethernet circuits. Nonswitched access revenue decreased $24.0 million, or
3%, to $935.8 million, as compared with 2012, primarily due to lower monthly recurring charges attributable to
a reduction in wireless backhaul and other business revenues. Carrier services excluding wireless backhaul
increased slightly, as we continue to provide network bandwidth to other communications carriers. We expect
wireless data usage to continue to increase, which may drive the need for additional wireless backhaul capacity.
Despite the need for additional capacity, we expect to experience declines in wireless backhaul revenue in
2014, as our carrier partners migrate to Ethernet solutions with a lower price point.
Data and Internet services revenue for 2012 decreased $8.7 million to $1,805.4 million, as compared with
2011. Data services revenue decreased $10.0 million to $845.6 million in 2012, as compared with 2011,
primarily due to higher promotional discounts and customer credits. As of December 31, 2012, the number of
45
FRONTIER COMMUNICATIONS CORPORATION AND SUBSIDIARIES


