Frontier Communications 2009 Annual Report Download - page 92
Download and view the complete annual report
Please find page 92 of the 2009 Frontier Communications annual report below. You can navigate through the pages in the report by either clicking on the pages listed below, or by using the keyword search tool below to find specific information within the annual report.-
 1
1 -
2
-
3
-
4
-
5
-
6
-
7
-
8
-
9
-
10
-
11
-
12
-
13
-
14
-
15
-
16
-
17
-
18
-
19
-
20
-
21
-
22
-
23
-
24
-
25
-
26
-
27
-
28
-
29
-
30
-
31
-
32
-
33
-
34
-
35
-
36
-
37
-
38
-
39
-
40
-
41
-
42
-
43
-
44
-
45
-
46
-
47
-
48
-
49
-
50
-
51
-
52
-
53
-
54
-
55
-
56
-
57
-
58
-
59
-
60
-
61
-
62
-
63
-
64
-
65
-
66
-
67
-
68
-
69
-
70
-
71
-
72
-
73
-
74
-
75
-
76
-
77
-
78
-
79
-
80
-
81
-
 82
82 -
 83
83 -
 84
84 -
 85
85 -
 86
86 -
 87
87 -
 88
88 -
 89
89 -
 90
90 -
 91
91 -
 92
92 -
 93
93 -
 94
94 -
 95
95 -
 96
96 -
 97
97 -
 98
98 -
 99
99 -
 100
100 -
 101
101 -
 102
102 -
103
-
104
-
105
-
106
-
107
 |
 |

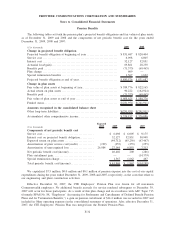
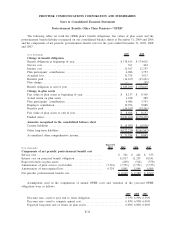
($ in thousands)
Before-Tax
Amount
Tax Expense/
(Benefit)
Net-of-Tax
Amount
2008
Net actuarial loss .................................... $(252,358) $(90,122) $(162,236)
Amortization of pension and postretirement costs ...... 4,795 1,712 3,083
All other ............................................ (4) — (4)
Other comprehensive (loss) . . ............................. $(247,567) $(88,410) $(159,157)
($ in thousands)
Before-Tax
Amount
Tax Expense/
(Benefit)
Net-of-Tax
Amount
2007
Amortization of pension and postretirement costs ....... $(3,023) $(6,880) $3,857
All other ............................................. 35 (12) 47
Other comprehensive income ............................... $(2,988) $(6,892) $3,904
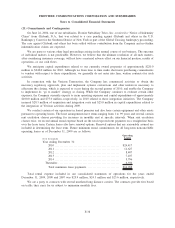
(17) Segment Information:
We operate in one reportable segment, Frontier. Frontier provides both regulated and unregulated voice,
data and video services to residential, business and wholesale customers and is typically the incumbent provider
in its service areas.
As permitted by ASC Topic 280 (formerly SFAS No. 131), we have utilized the aggregation criteria in
combining our operating segments because all of our Frontier properties share similar economic characteristics,
in that they provide the same products and services to similar customers using comparable technologies in all of
the states in which we operate. The regulatory structure is generally similar. Differences in the regulatory
regime of a particular state do not materially impact the economic characteristics or operating results of a
particular property.
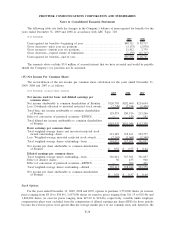
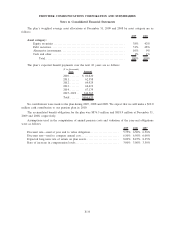
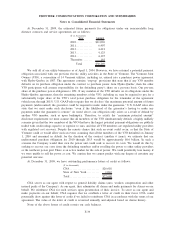
(18) Quarterly Financial Data (Unaudited):
($ in thousands, except per share amounts)
First Quarter Second Quarter Third Quarter Fourth Quarter Total Year
2009
Revenue . . . . . . . . . . . . . . . . . . . . . . $537,956 $532,142 $526,816 $520,980 $2,117,894
Operating income . . . . . . . . . . . . . 139,510 136,616 172,490 157,549 606,165
Net income attributable to
common shareholders of
Frontier . . . . . . . . . . . . . . . . . . . . 36,303 27,918 52,159 4,403 120,783
Net income available for
common shareholders per
basic and diluted share . . . . . . $ 0.12 $ 0.09 $ 0.17 $ 0.01 $ 0.38
2008
Revenue . . . . . . . . . . . . . . . . . . . . . . $569,205 $562,550 $557,871 $547,392 $2,237,018
Operating income . . . . . . . . . . . . . 164,312 161,969 164,241 151,934 642,456
Net income attributable to
common shareholders of
Frontier . . . . . . . . . . . . . . . . . . . . 45,589 55,778 46,995 34,298 182,660
Net income available for
common shareholders per
basic and diluted share . . . . . . $ 0.14 $ 0.17 $ 0.15 $ 0.11 $ 0.57
The quarterly net income per common share amounts are rounded to the nearest cent. Annual net income
per common share may vary depending on the effect of such rounding. We recognized $10.8 million ($6.8
F-30
FRONTIER COMMUNICATIONS CORPORATION AND SUBSIDIARIES
Notes to Consolidated Financial Statements