Frontier Communications 2009 Annual Report Download - page 52
Download and view the complete annual report
Please find page 52 of the 2009 Frontier Communications annual report below. You can navigate through the pages in the report by either clicking on the pages listed below, or by using the keyword search tool below to find specific information within the annual report.-
 1
1 -
2
-
3
-
4
-
5
-
6
-
7
-
8
-
9
-
10
-
11
-
12
-
13
-
14
-
15
-
16
-
17
-
18
-
19
-
20
-
21
-
22
-
23
-
24
-
25
-
26
-
27
-
28
-
29
-
30
-
31
-
32
-
33
-
34
-
35
-
36
-
37
-
38
-
39
-
40
-
41
-
 42
42 -
 43
43 -
 44
44 -
 45
45 -
 46
46 -
 47
47 -
 48
48 -
 49
49 -
 50
50 -
 51
51 -
 52
52 -
 53
53 -
 54
54 -
 55
55 -
 56
56 -
 57
57 -
 58
58 -
 59
59 -
 60
60 -
 61
61 -
 62
62 -
63
-
64
-
65
-
66
-
67
-
68
-
69
-
70
-
71
-
72
-
73
-
74
-
75
-
76
-
77
-
78
-
79
-
80
-
81
-
82
-
83
-
84
-
85
-
86
-
87
-
88
-
89
-
90
-
91
-
92
-
93
-
94
-
95
-
96
-
97
-
98
-
99
-
100
-
101
-
102
-
103
-
104
-
105
-
106
-
107
 |
 |

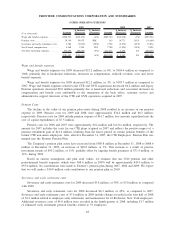
ACQUISITION AND INTEGRATION COSTS
($ in thousands) Amount
$ Increase
(Decrease)
% Increase
(Decrease) Amount
$ Increase
(Decrease)
% Increase
(Decrease) Amount
2009 2008 2007
Acquisition and integration costs. . . . . . . . $28,334 $28,334 100% $— $— — $—
Acquisition and integration costs represent expenses incurred to close the transaction (legal, financial
advisory, accounting, regulatory and other related costs) and integrate the network and information technology
platforms. While the Company continues to evaluate certain other expenses, we currently expect to incur
acquisition and integration costs of approximately $100.0 million in 2010. We anticipate closing the Verizon
Transaction during the second quarter of 2010.
INVESTMENT INCOME/OTHER INCOME (LOSS), NET / INTEREST EXPENSE /
INCOME TAX EXPENSE
($ in thousands) Amount
$ Increase
(Decrease)
% Increase
(Decrease) Amount
$ Increase
(Decrease)
% Increase
(Decrease) Amount
2009 2008 2007
Investment income ................... $ 6,285 $ (9,833) (61%) $ 16,118 $(21,523) (57%) $ 37,641
Other income (loss), net . . . . . . . . . . . . . . $ (41,127) $(35,957) NM $ (5,170) $ 12,663 71% $ (17,833)
Interest expense . . . ................... $378,214 $ 15,580 4% $362,634 $(18,062) (5%) $380,696
Income tax expense . . . . . . . . . . . . . . . . . . $ 69,928 $(36,568) (34%) $106,496 $(21,518) (17%) $128,014
Investment Income
Investment income for 2009 declined $9.8 million, or 61%, to $6.3 million as compared with 2008
primarily due to reduced equity earnings of $4.2 million and a decrease of $5.6 million in income from short-
term investments of cash and cash equivalents, as higher cash balances were more than offset by significantly
lower short-term investment rates.
Investment income for 2008 decreased $21.5 million, or 57%, to $16.1 million as compared to 2007,
primarily due to a decrease of $22.1 million in income from short-term investments of cash and cash
equivalents due to a lower investable cash balance.
Our average cash balances were $318.0 million, $177.5 million and $594.2 million for 2009, 2008 and
2007, respectively. The 2007 amount reflects the impact of borrowing $550.0 million in December 2006 in
anticipation of the Commonwealth acquisition in 2007.
Other Income (Loss), net
Other income (loss), net for 2009 declined $36.0 million to $(41.1) million as compared with 2008,
primarily due to premiums paid on the early retirement of debt of $45.9 million in 2009, partially offset by
increased litigation settlement proceeds of $3.8 million.
Other income (loss), net for 2008 improved $12.7 million, or 71%, to $(5.2) million as compared to 2007.
Other income (loss), net improved in 2008 primarily due to a reduction in the loss on retirement of debt of
$11.9 million and the $4.1 million expense of a bridge loan fee recorded during the first quarter of 2007.
Interest Expense
Interest expense for 2009 increased $15.6 million, or 4%, to $378.2 million as compared with 2008,
primarily due to higher average debt levels and interest rates in 2009. Our composite average borrowing rate as
of December 31, 2009 as compared with the prior year was 31 basis points higher, increasing from 7.54% to
7.85%.
Interest expense for 2008 decreased $18.1 million, or 5%, to $362.6 million as compared to 2007,
primarily due to the amortization of the deferred gain associated with the termination of our interest rate swap
agreements and retirement of related debt during the first quarter of 2008, along with slightly lower average
50
FRONTIER COMMUNICATIONS CORPORATION AND SUBSIDIARIES